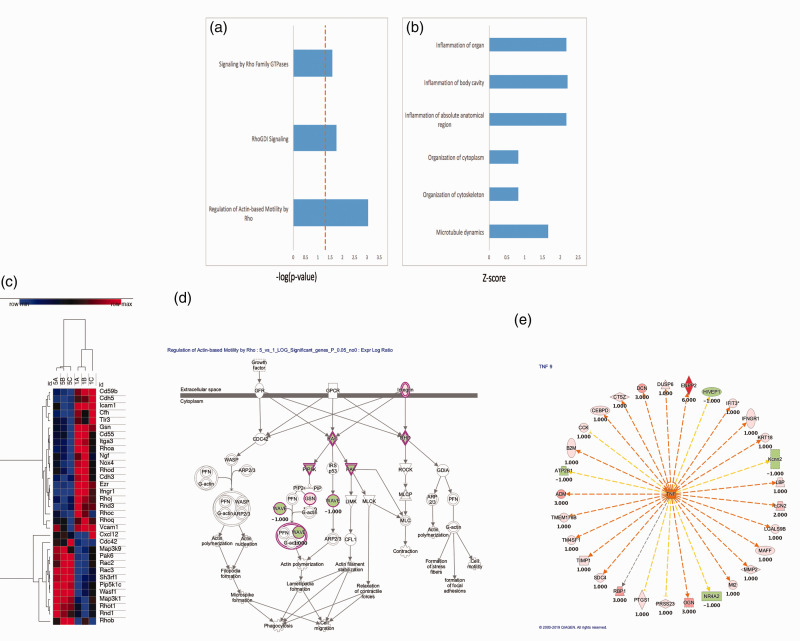
Figure 3.
Clariom S Mouse array of murine neurons after hydrogen peroxide injury. (a) Rho Family GTPases and related pathways were upregulated. (b) Inflammatory pathways, cytoskeleton and microtubule pathways were also upregulated. (c) Gene expression microarray analysis comparing control neurons (1 A-C) with H2O2-oxidant damaged neurons (5 A-C): Clustering of the samples according to their expression profile. High expression is indicated in red. Low expression is indicated in blue. Hierarchical clustering was performed using the one minus Pearson correlation. (d and e) Graphical representation of two top scored networks identified by ingenuity pathway analysis (IPA). Canonical pathways from IPA for control neurons compared to oxidant damaged neurons. Molecular relationships between genes after treatment are shown demonstrating changes in genes related to mitochondrial motility (d) and upstream regulators of tumor necrosis factor (TNF) (e) with positive numbers representing upregulation with oxidant damage and negative numbers representing downregulation.

