Figure 1.
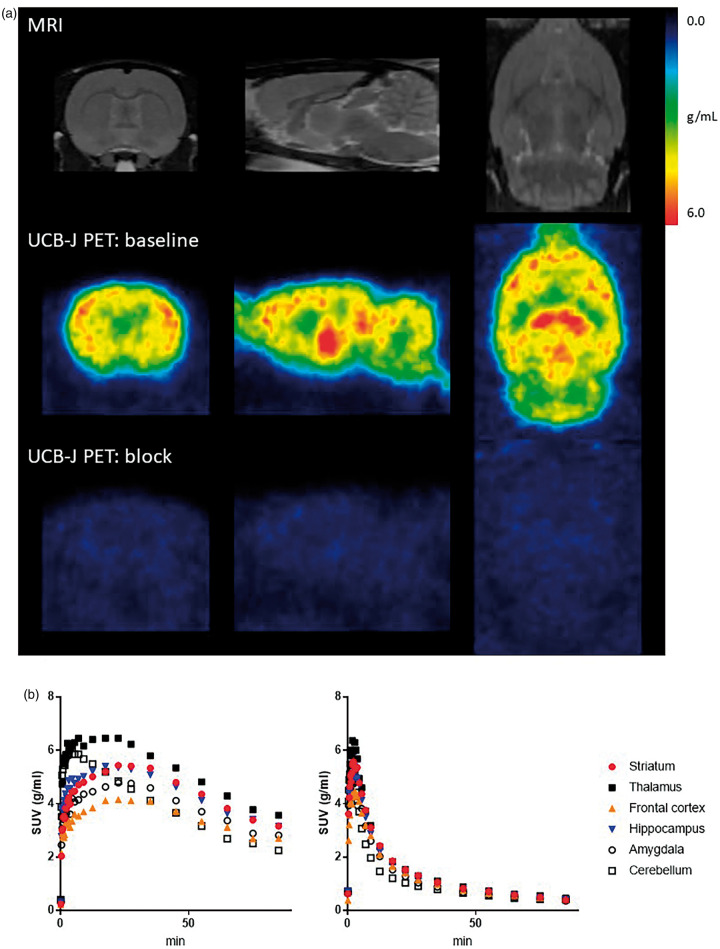
[11C]UCB-J PET in naïve rodent brain. (a) Rat MRI template (top) and representative standard uptake value (SUV) images (average of 30–90 min) of [11C]UCB-J PET scan at baseline condition (middle) and after administration of 100 mg/kg LEV (bottom) in the same rat shown at the coronal (left), sagittal (middle) and transverse (right) plane. (b) Representative SUV time activity curves at baseline condition (left) and after administration of 100 mg/kg LEV (right) in the same rat.

