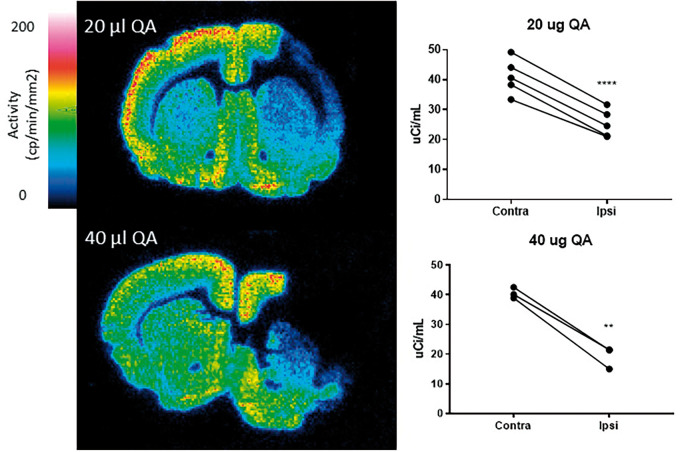
Figure 6.
[3H]UCB-J autoradiography images of representative animals after unilateral lesion to the right striatum with 20 µg QA (top) and 40 µg QA (bottom). Graphs to the right of each image show [3H]UCB-J autoradiography values in the contra- and ipsilateral striatum in each model. **p-value < 0.01, ****p-value < 0.0001.

