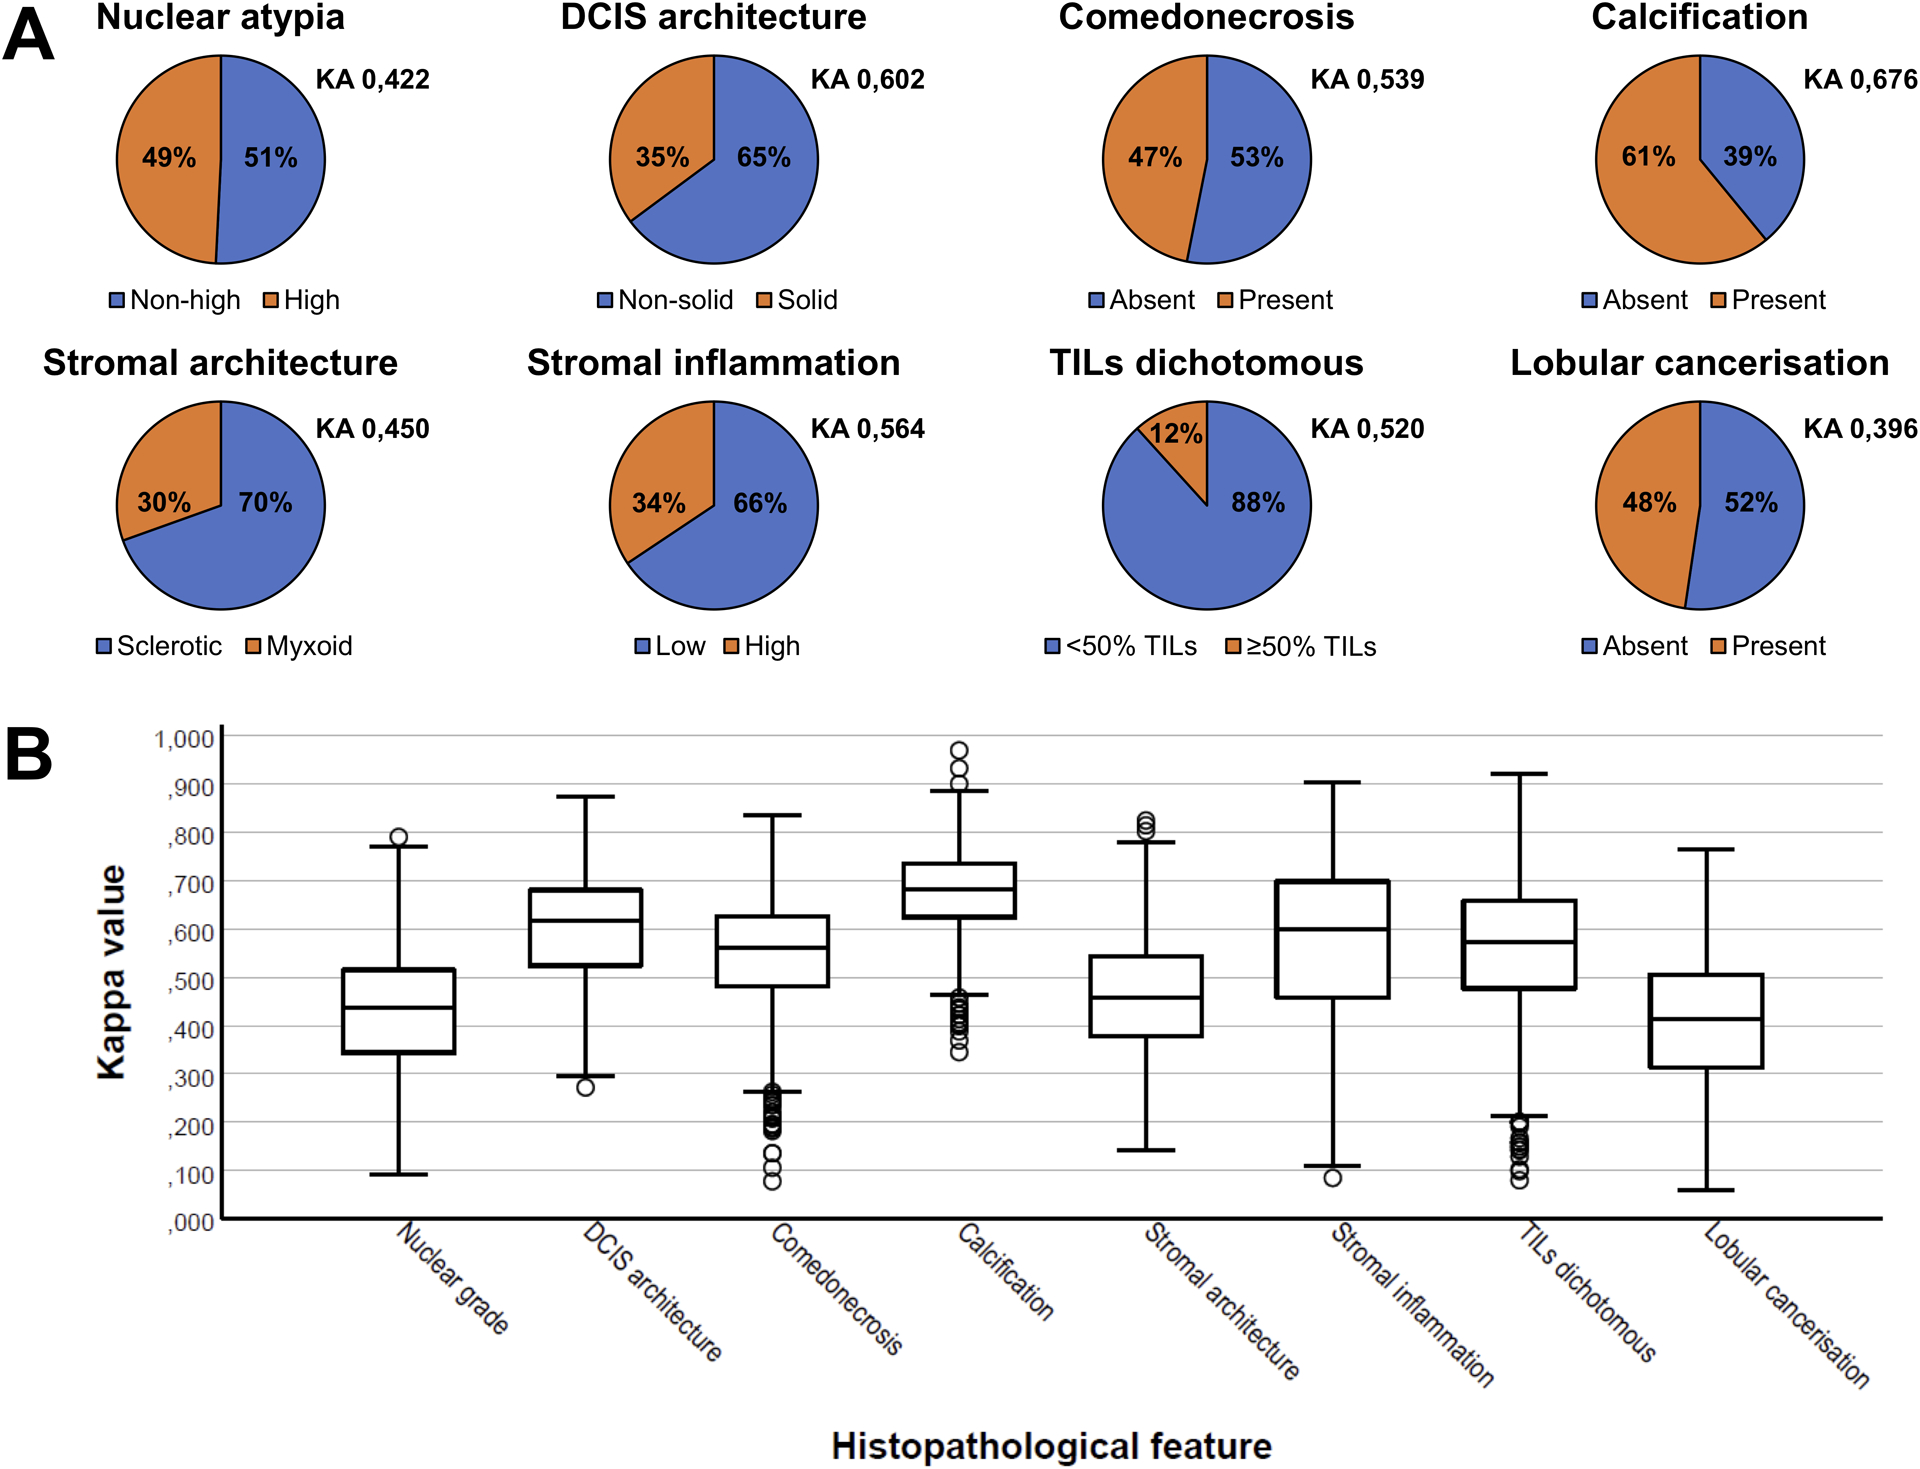
Figure 1.

(A) Pie charts illustrating the histopathological assessment of the ‘average pathologist’ (Px) as a percentage, based on the arithmetic mean of all pathologists’ scores per dichotomously assessed histopathological feature. KA signifies the Krippendorff’s alpha statistic per feature. (B) Box-and-whisker plots illustrating the differences in the distribution in Cohen’s kappa values per pathologist duo per histopathological feature. Circles represent outliers. DCIS: ductal carcinoma in situ. TILs: tumor-infiltrating lymphocytes.
