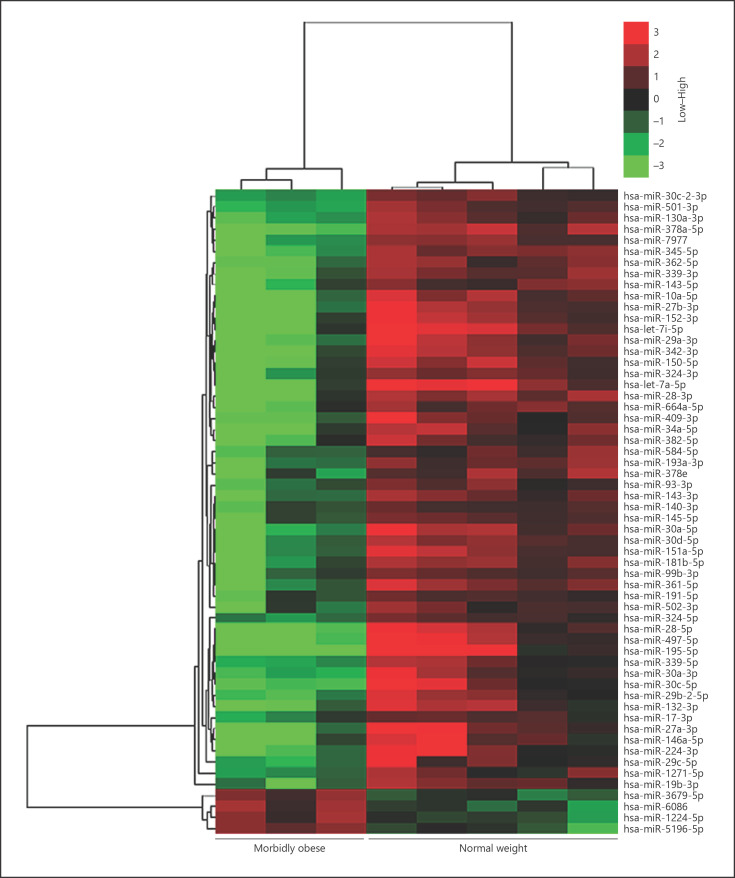
Fig. 1.
Hierarchical clustering of the differential miRNAs in the SAT of the study groups. Fifty-eight differentially regulated miRNAs of morbidly obese (n = 3) and normal-weight (n = 5) subjects were hierarchically clustered and represented using TreeView. In the SAT of morbidly obese subjects, 54 miRNAs were downregulated and 4 were upregulated. Red, high expression; green, low expression. The intensity represents the magnitude of the expression difference. The 2 closest remaining items (those with the smallest distance) are joined by a node/branch of a tree, with the length of the branch set to the distance between the joined items.

