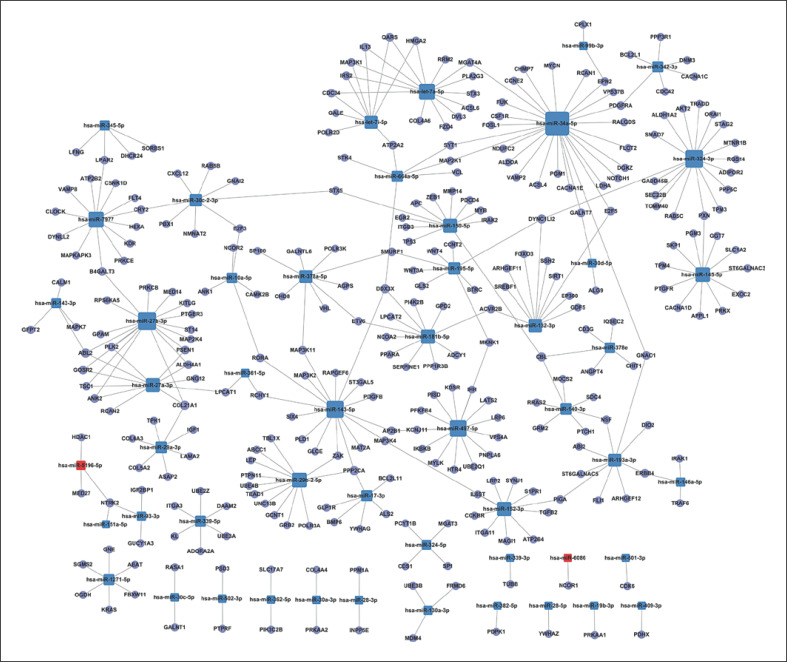
Fig. 3.
The miRNA-gene-network. The network generated by Cytoscape displays the interactions between the key differential miRNAs and predicted target genes. Blue, downregulated miRNAs; red, upregulated miRNAs. The miRNAs are depicted by squares and the predicted genes as circles. Their interaction is represented by one edge.

