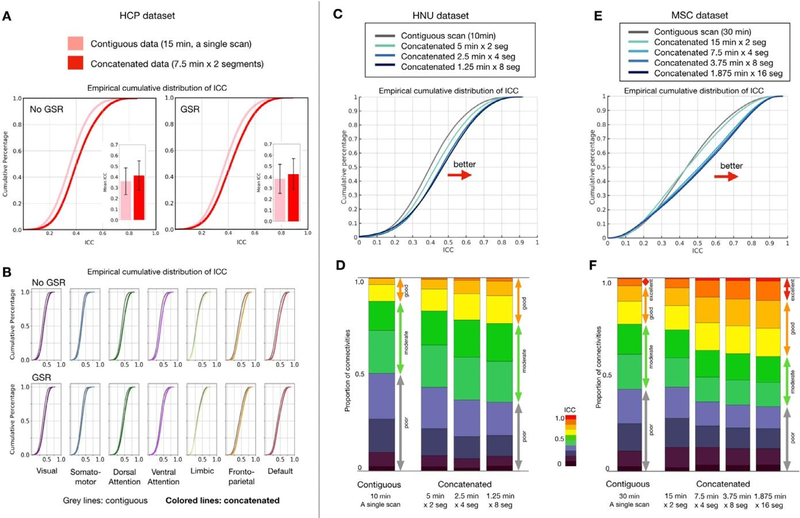
Fig. 2.
Edgewise functional connectivity calculated from concatenated scans is more reliable than that based on a single contiguous scan of equal length. (A) Empirical cumulative distribution and bar plots of mean intraclass correlation coefficient (ICC) with error bars (standard deviation) for test-retest reliability of functional connectivities from contiguous and concatenated resting-state fMRI scans; results for calculation based on data with and without global signal regression (GSR) are depicted. (B) Empirical cumulative distribution of ICC for each network. Distribution of ICC from contiguous data is shown in gray while colored lines represent ICC from concatenated data. See FC and ICC matrices in Fig S1B. (C) Empirical cumulative distribution of ICC and (D) stacked bar plots depicting proportion of connections with poor, moderate, good and excellent ICC for contiguous and concatenated resting-state scans, calculated using the HNU dataset and the Midnight Scan Club dataset (E, F). (For interpretation of the references to color in this figure legend, the reader is referred to the web version of this article.)

