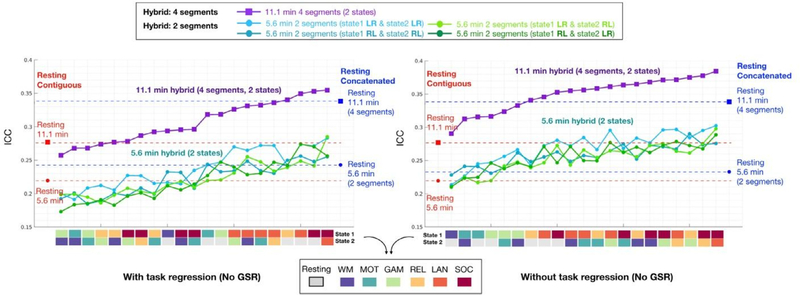
Fig. 4.
Reliability of edgewise functional connectivity measures calculated for resting and hybrid data generated from 2 tasks using either 2 or 4 segments without GSR. The label color for task states from cold to warm represents the reliability (i.e., mean ICC) of each state from low to high (detailed distribution shown in Fig. 3A). The same length of contiguous resting data was truncated from LR scans of the Day 1 session (red dots, 5.6 min; red square: 11.1 min). The concatenated resting data was generated from 2 scans (blue dot: 5.6 min, LR and RL scans from Day 1) and 4 scans (blue square: 11.1 min, LR, RL scans from Day 1 and Day 2). See results with GSR in Fig. S5. (For interpretation of the references to color in this figure legend, the reader is referred to the web version of this article.)

