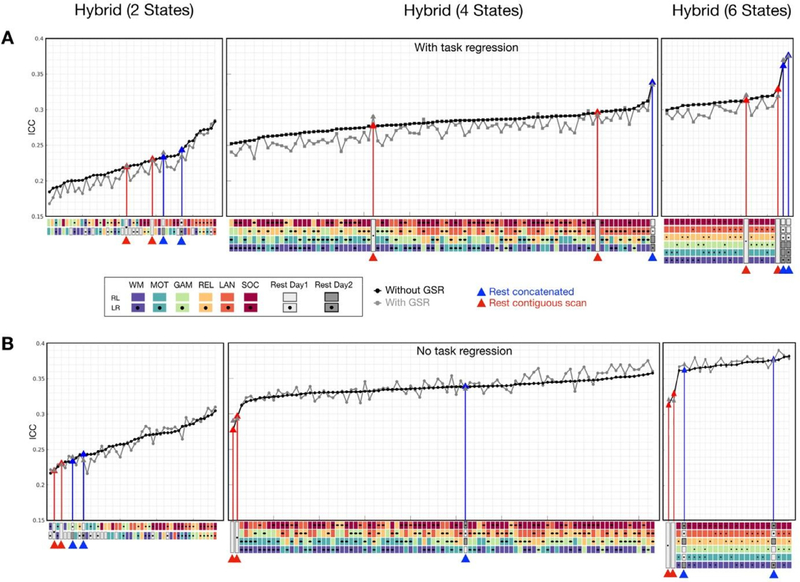
Fig. 5.
Reliability of edgewise functional connectivity for resting and hybrid data as a function of the numbers of states combined in the concatenation process (2, 4 and 6 different states). The mean ICC for data preprocessed with GSR (gray) and without GSR (black) was shown in ascending order. The same length of contiguous resting data was truncated from LR and RL scans of Day 1 session (highlighted with red lines). The concatenated resting data was generated from 2, 4, and 6 segments of resting scans (highlighted with blue lines). (For interpretation of the references to color in this figure legend, the reader is referred to the web version of this article.)

