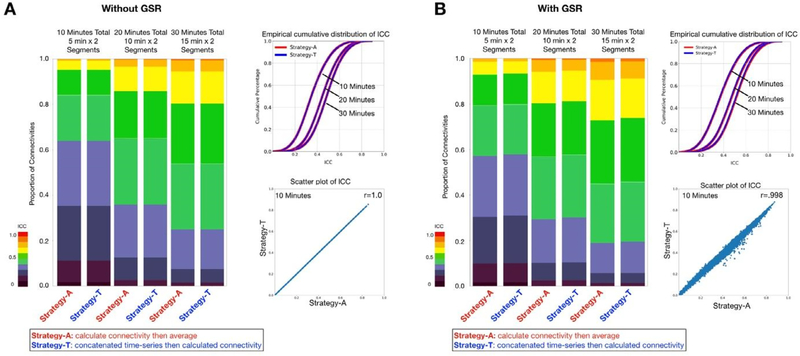
Fig. 8.
Calculation of edgewise functional connectivity measures for scans individually and then averaging, versus calculation after concatenation of scans. Two segments of 5 min, 10 min, and 15 min of data were generated. The strategy calculating the FC of each segment first then average all the FC as the final FC for each subset was denoted as Strategy-A, while concatenating time-series of all segments then calculating FC per subset as Strategy-T. The stacked bar and the empirical cumulative distribution of ICC showed no differences in ICC distribution between two strategies. The scatter plot shows the ICC of functional connectivity was almost the same between two strategies for 10 min data (2 segments x 5 min).

