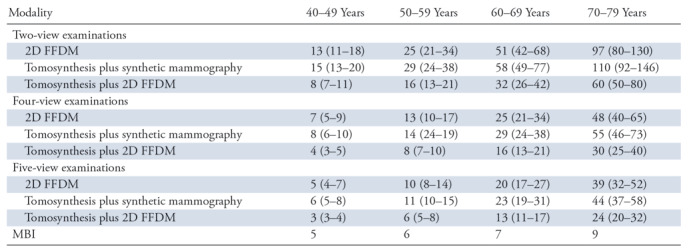
Table 2:
Estimated Benefit-to-Risk Ratios for Annual Screening according to Age Range

Note.—Data are for pooled compressed breast thickness values. Numbers in parentheses are the range of benefit-to-risk ratio estimates based on the 25th–75th-percentile mammography dose ranges. FFDM = full-field digital mammography, MBI = molecular breast imaging, 2D = two dimensional.
