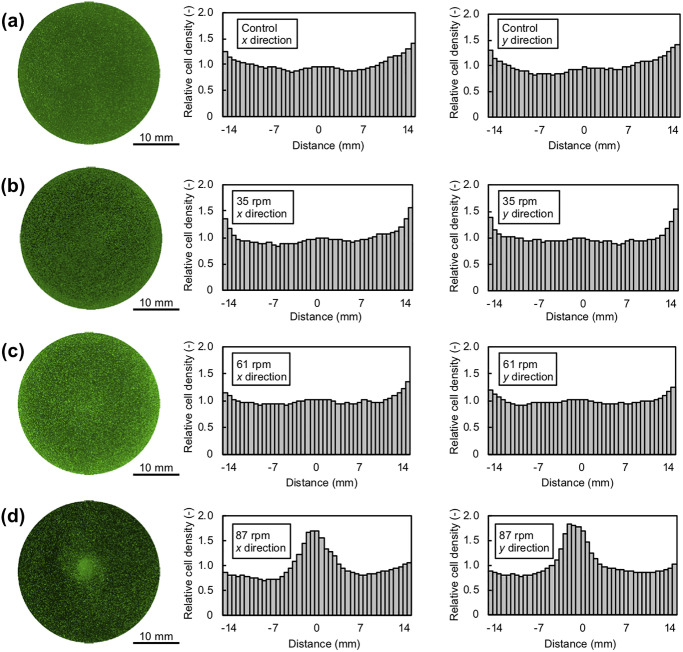
Fig 4. Fluorescence microscopy images of culture dishes and relationship between relative cell densities along the x and y directions (n = 3).
(a-d) Cells were seeded in culture dishes without shaking (a) or with shaking at 35 rpm (b), 61 rpm (c), or 87 rpm (d) for 3 min. The green fluorescence shows viable cells.

