
Figure 5:
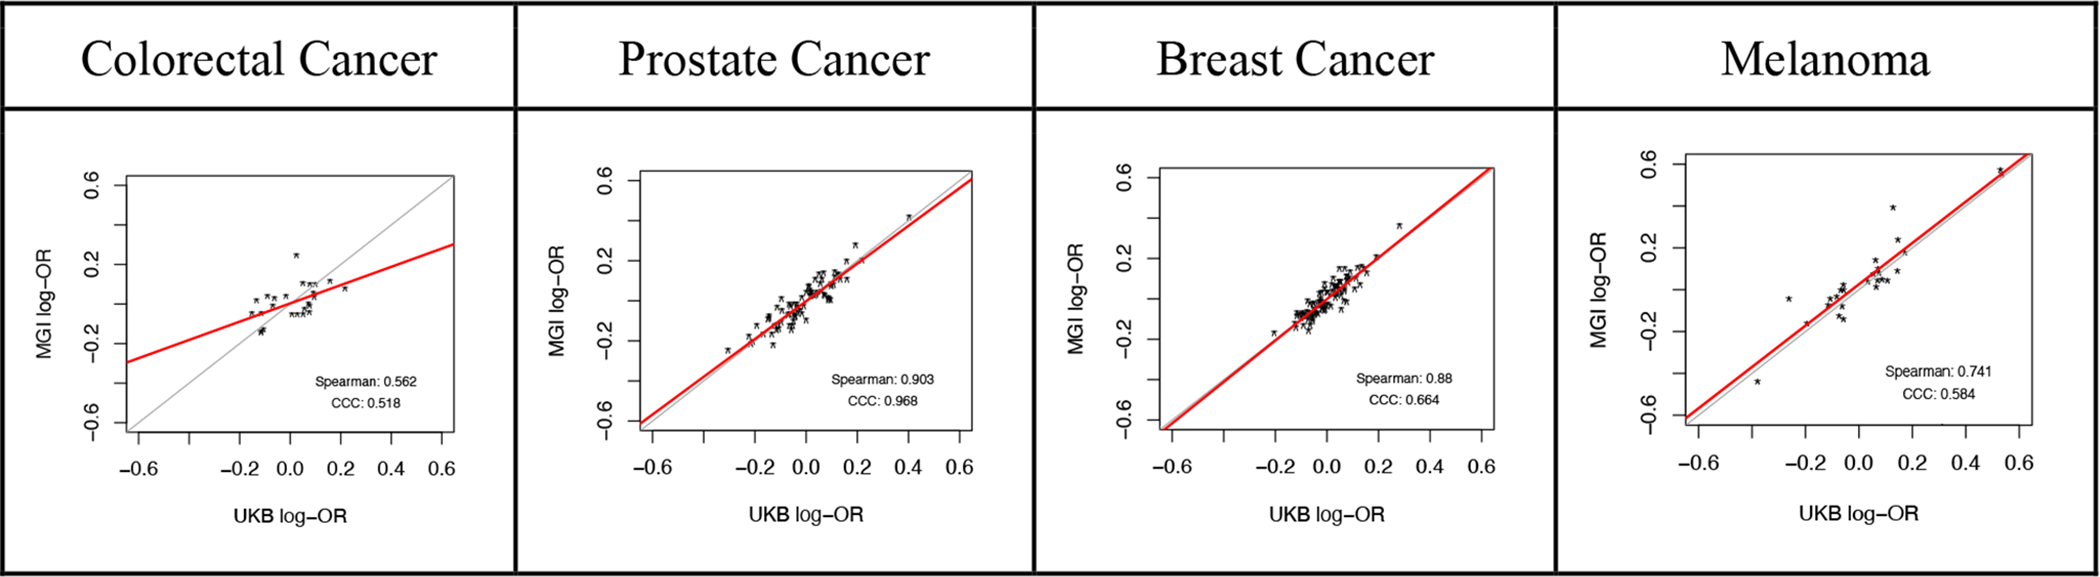
Comparison of GWAS Results in MGI and UK Biobank for Selected Cancer Phenotypes*
* Each point represents a SNP identified as being related to the corresponding phenotype in the NHGRI-EBI GWAS catalog. The point location corresponds to the log-odds ratio association between the SNP and the phenotype of interest in MGI and UK Biobank. The two lines correspond to equality of the estimates and a fitted line to the points (excluding any outlying points with absolute log-OR greater than 0.6). “Spearman” indicates the Spearman correlation and “CCC” indicates Lin’s concordance correlation coefficient, which is a measure of agreement (with 1 being perfect agreement).