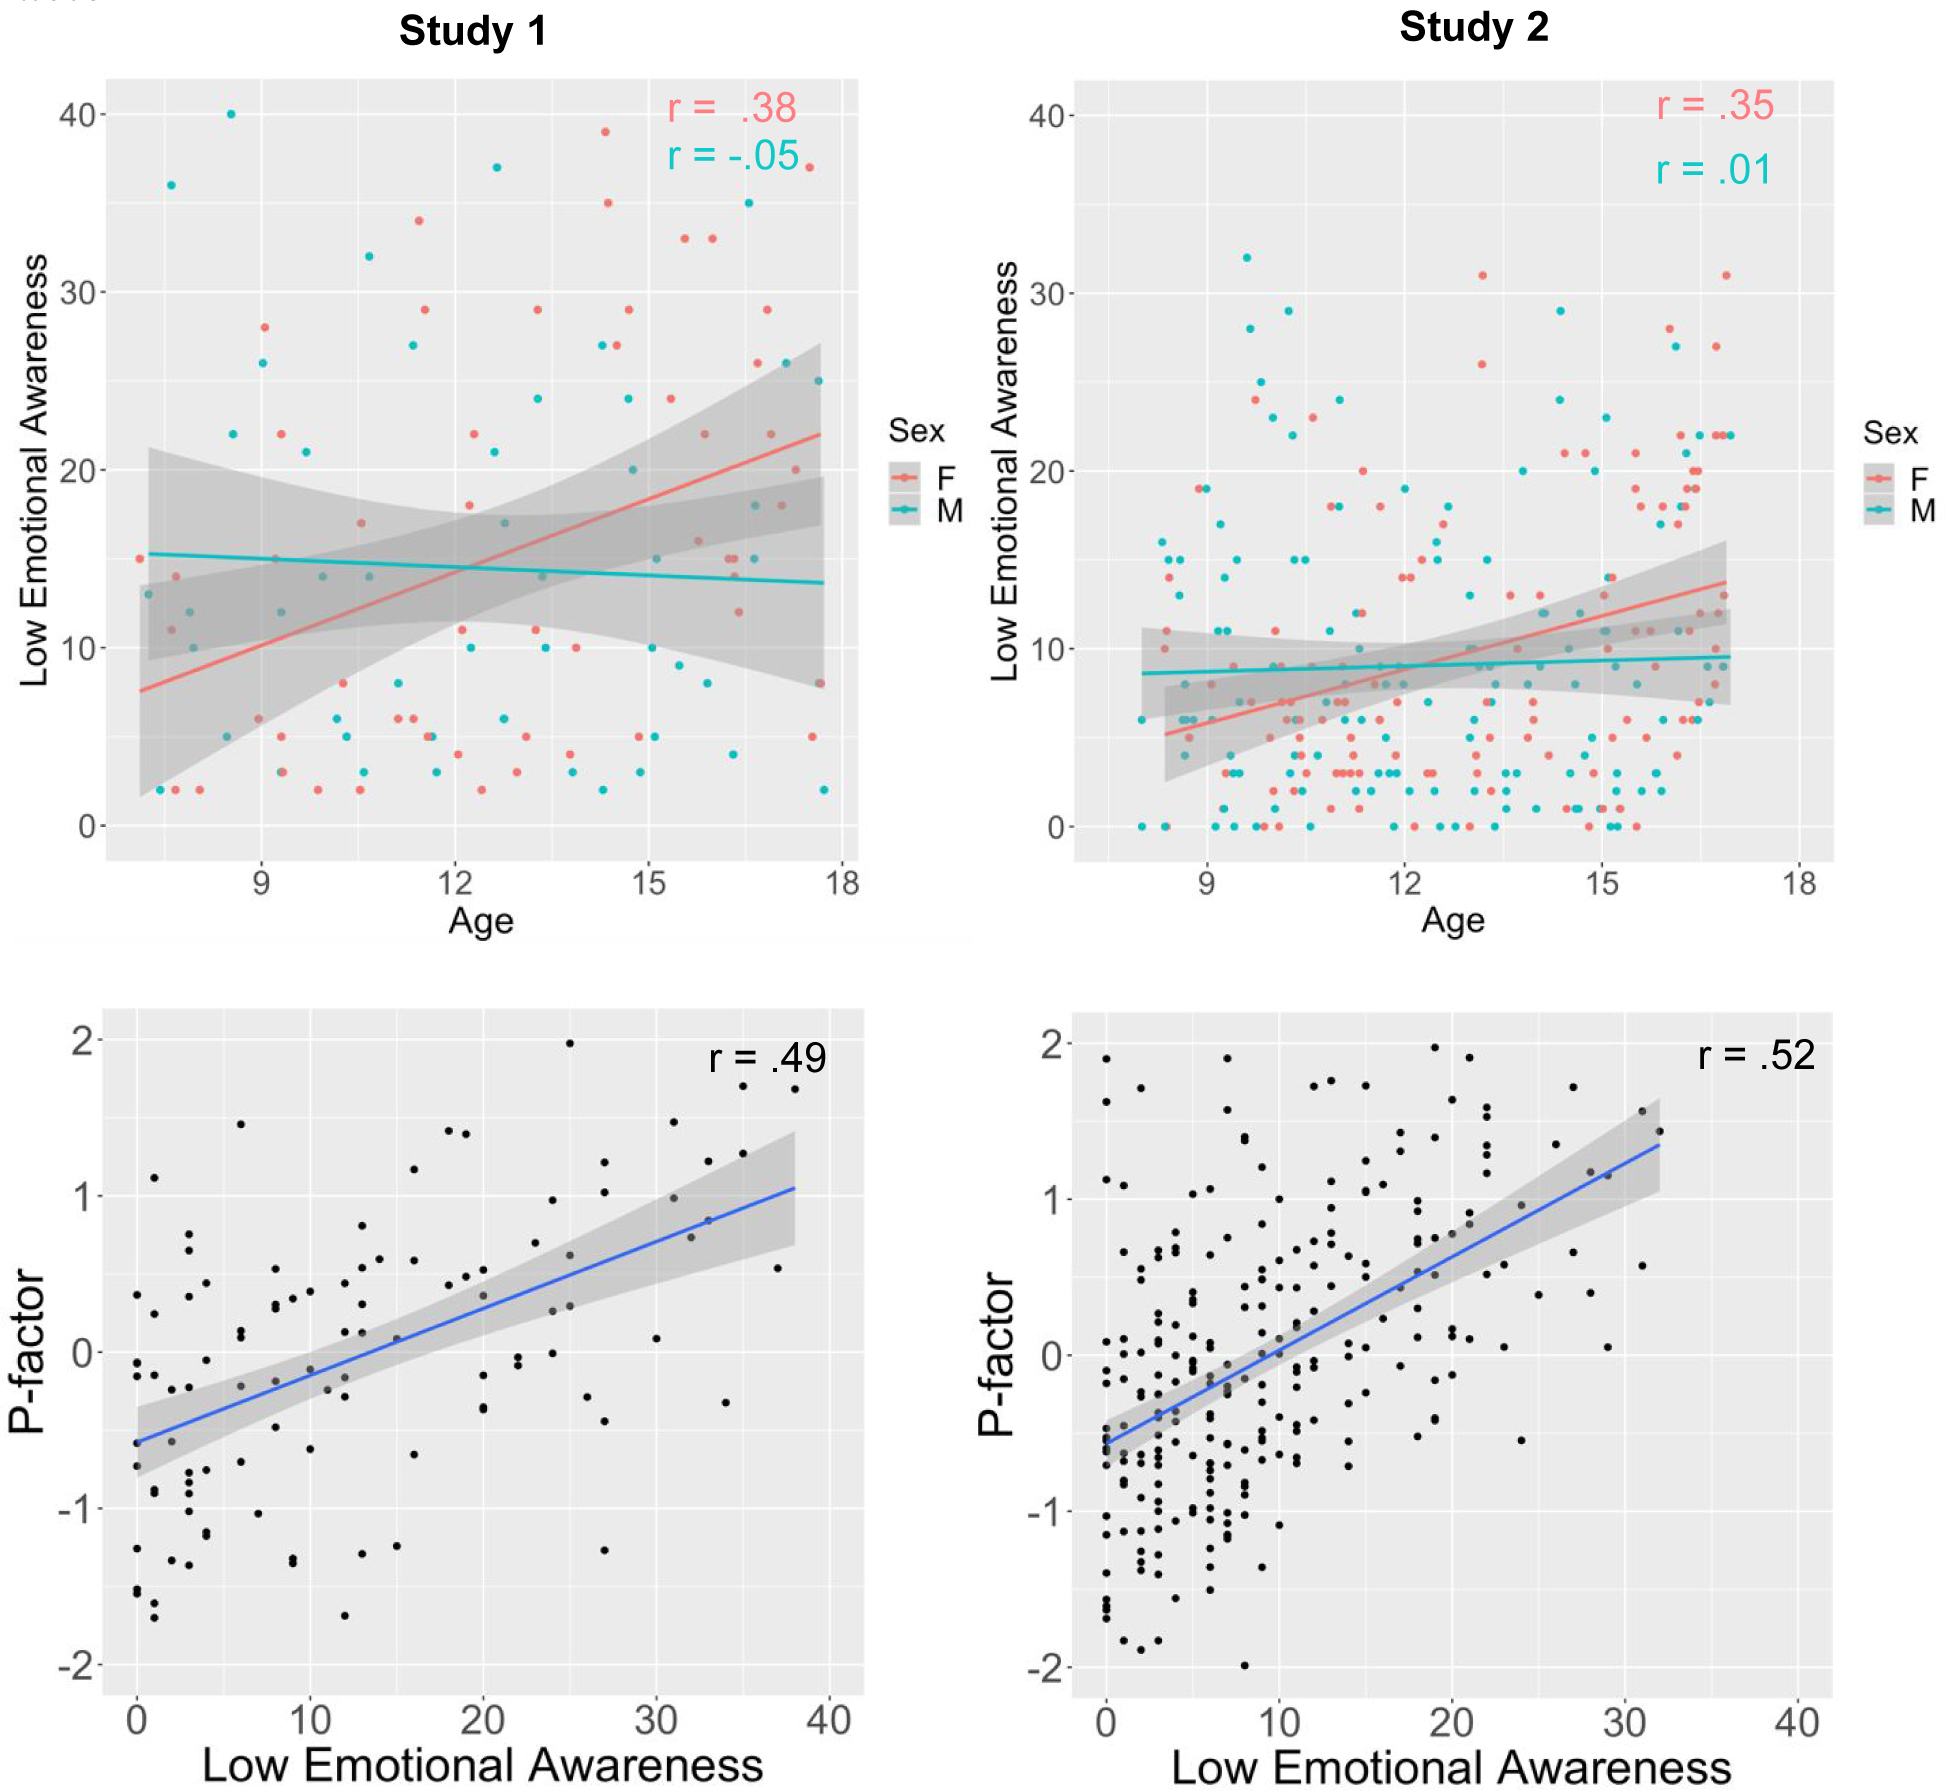
Figure 1: Scatterplots of relations between sex, age, low emotional awareness, and the p-factor.

Low emotional awareness was measured with different instruments in studies 1 and 2. For ease of interpretation and visualization purposes, both scales were centered on their minimum value. Higher scores indicate lower emotional awareness. M = male, F = female, Age is in years.
