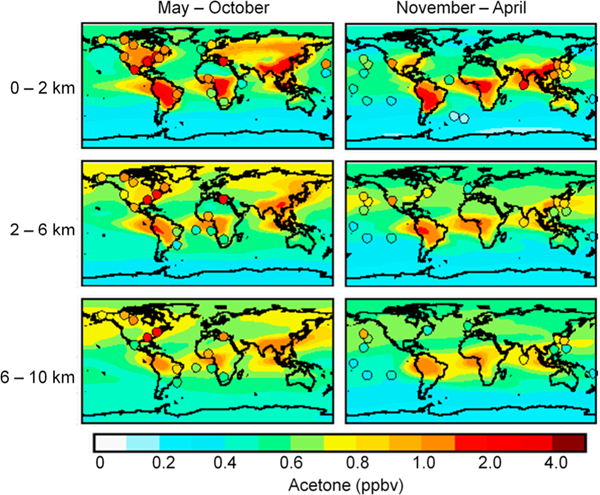
Figure 1.
Simulated and observed global distribution of atmospheric acetone for two seasons and three altitude bins. Simulated mixing ratios are for 2006 and are shown as solid contours. Filled circles are vertically binned mean observations in different years from aircraft missions, ship cruises and surface sites [de Gouw et al., 2001, 2006; Hornbrook et al., 2011; Jacob et al., 1996; Lelieveld et al., 2002; Lewis et al., 2005; Mao et al., 2006; Marandino et al., 2005; Murphy et al., 2010; Singh et al., 2000, 2009, 2001, 1994, 2004; Warneke and de Gouw, 2001; Williams et al., 2004]. Data for aircraft missions have been averaged over regionally coherent regions as in Jacob et al. [2002] with the addition of more recent missions. Data from ship cruises are primarily the averages reported in the literature. Circles are placed at the mean latitude and longitude of the observations. Table S1 gives details of the observations. Figures S1 and S2 show comparisons with the aircraft vertical profiles.

