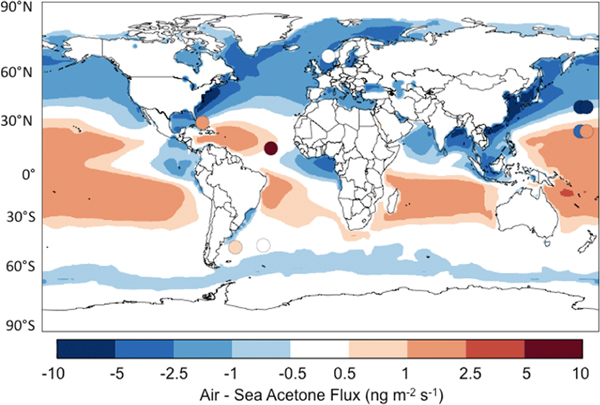
Figure 2.
Simulated annual mean air-sea fluxes of acetone for 2006, and mean observed air-sea fluxes (Table 2, third column). Positive values indicate a net flux from the sea to the air. Marandino et al. [2005] report a discrepancy between the flux calculated from the saturation ratio and that measured by eddy covariance. Both are shown here over the western Pacific, with the measured fluxes plotted to the west of the calculated fluxes. There is seasonal variation to the net air-sea fluxes, and Figure S3 presents the fluxes for January and July.

