
Fig. 7.
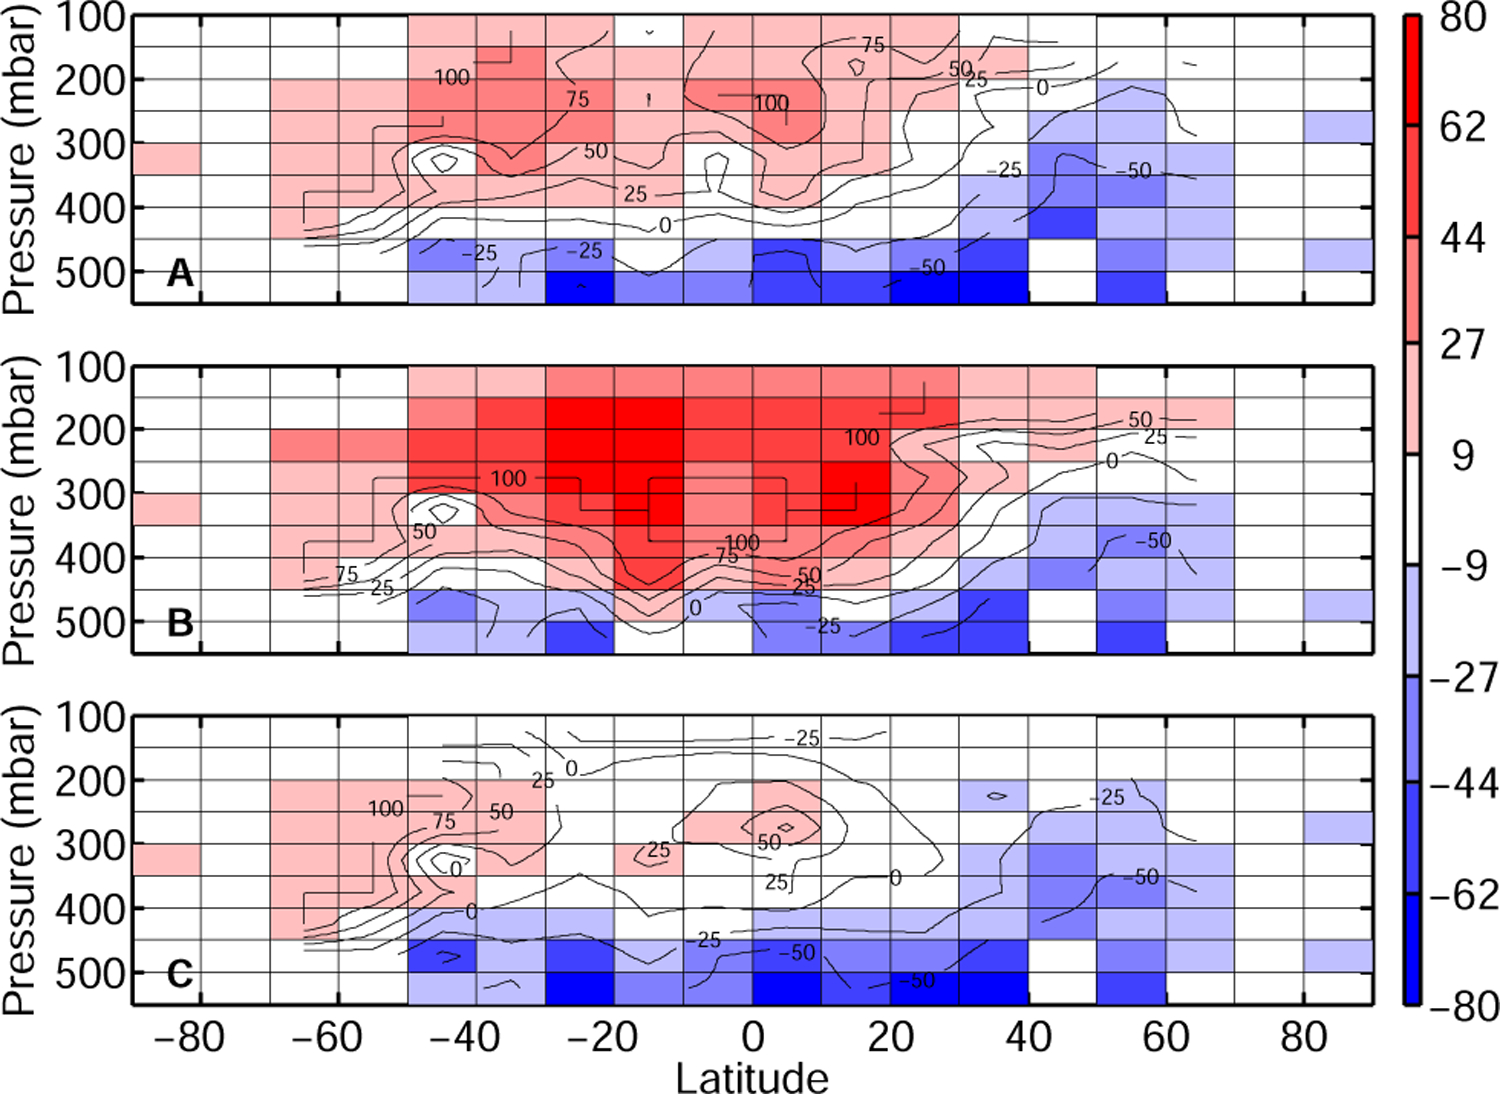
Comparison of the simulated FA with observations by ACE-FTS suggests an altitude-dependent error. Increasing the reaction rate of OH with FA reduces the model high-bias in the upper troposphere (C) while injection of biomass burning in the free troposphere provides little improvement in the middle troposphere while degrading FA simulation in the upper troposphere (B). Absolute difference between the model and the ACE-FTS measurement is shown in pptv with contours indicating the relative difference in % ((model-measurement)/measurement). Cells with no measurements are grayed. Panel (A) shows the comparison for the reference run (R1), Panel (B) for R2b and Panel (C) for R4 (see Sect. 4). The model is sampled at the location and time of the ACE-FTS measurement.