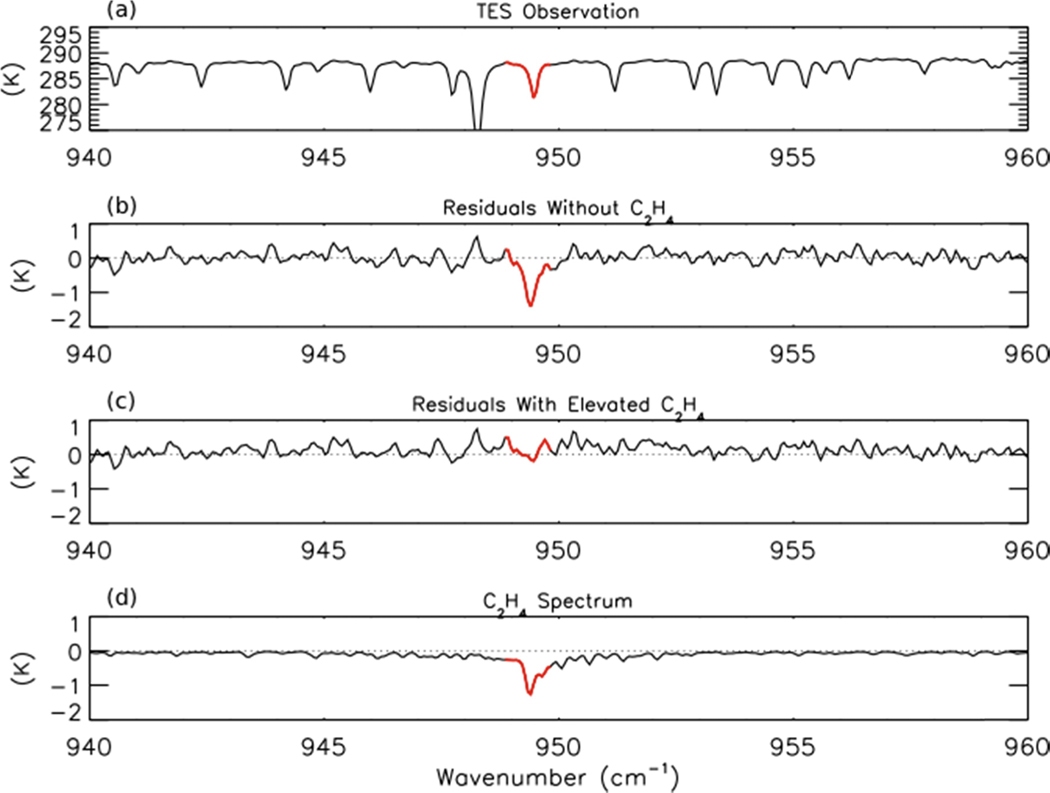
Figure 10.
(a) TES observed brightness temperature spectrum, (b) residuals without a C2H4 profile in the model, calculated as observed minus modeled spectrum, (c) residuals after addition of a hypothetical profile of C2H4, and (d) the modeled spectrum of C2H4 for the same TES scan as shown in Figure 1. The area of strong absorption by C2H4, corresponding to the ν7 Q-branch, is shown in red.

