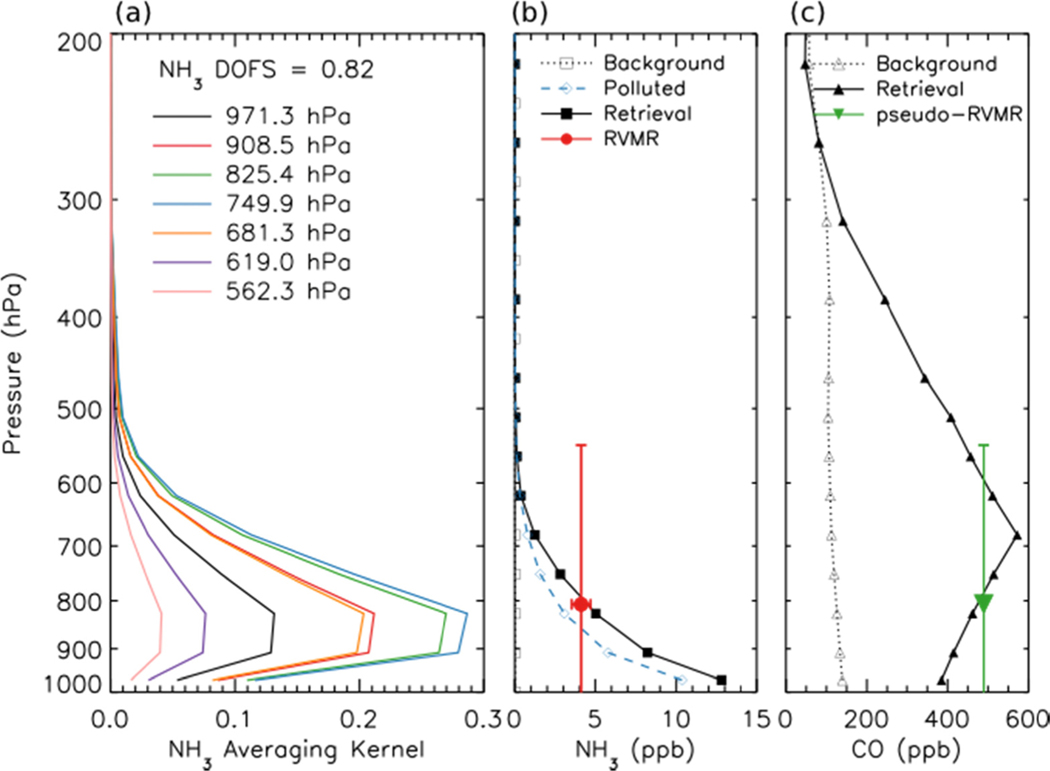
Figure 2.
(a) NH3 averaging kernel for the same TES scan as shown in Figure 1. (b) Background unpolluted NH3 profile (open black squares), polluted a priori NH3 profile (open blue diamonds), retrieved NH3 profile (filled black squares) and NH3 Representative Volume Mixing Ratio (RVMR) (red circle) for the same scan. The horizontal error bars show the uncertainty in the RVMR due to noise in the TES spectrum, while the vertical bars encompass the region of TES sensitivity to NH3. (c) Background (and a priori) CO profile (open black triangles), retrieved CO profile (filled black triangles) and CO pseudo-RVMR (green inverted triangle) for the same scan.

