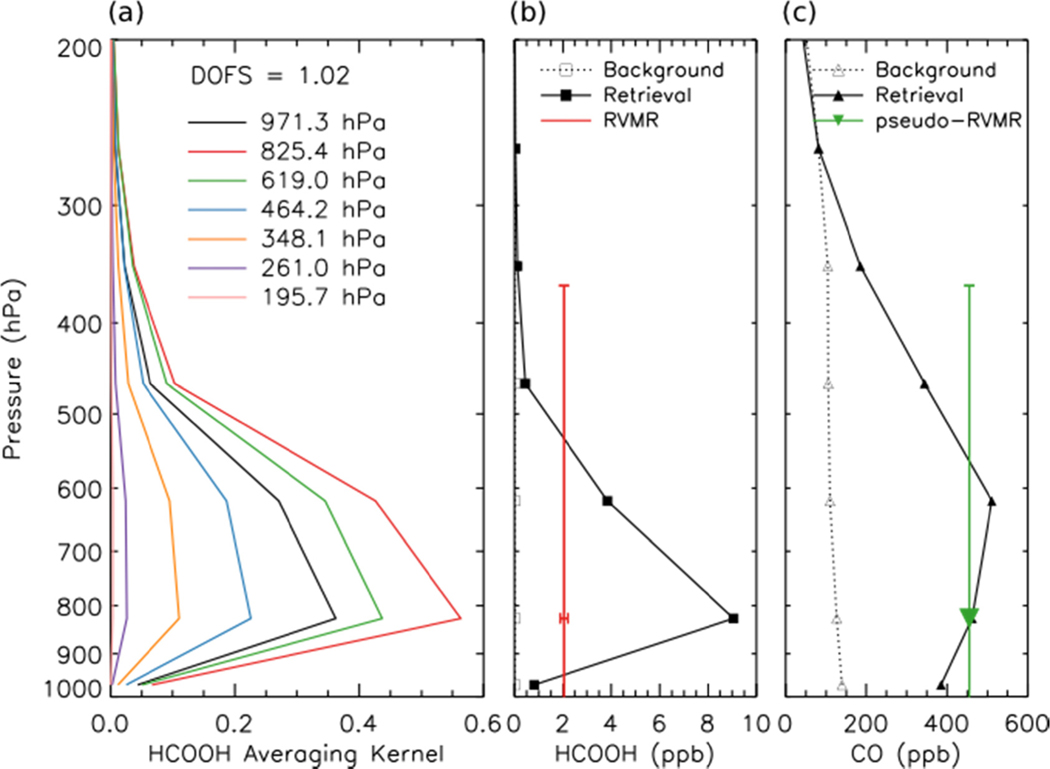
Figure 4.
(a) HCOOH averaging kernel for the same TES scan as shown in Figure 1. (b) Background (and a priori) HCOOH profile (open black squares), retrieved HCOOH profile (filled black squares), and HCOOH RVMR (intersection of red lines) for the same scan. The red dot was omitted so that the horizontal error bars would be visible. (c) Background (and a priori) CO profile (open black triangles), retrieved CO profile (filled black triangles) and CO pseudo-RVMR (green inverted triangle) for the same scan.

