
Figure 2.
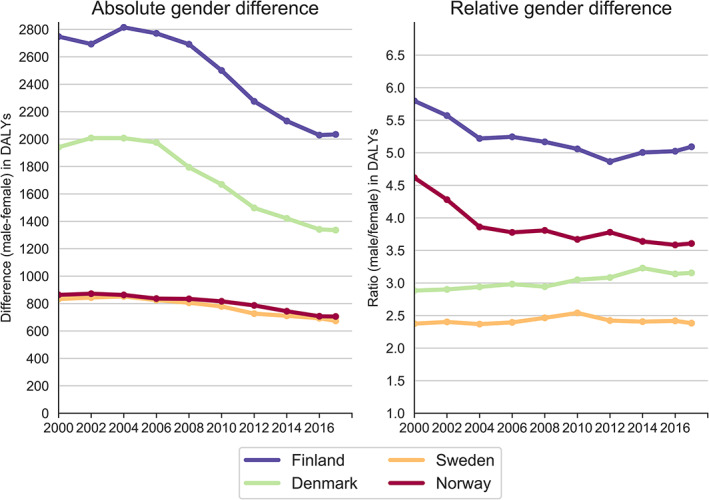
Absolute and relative gender differences in overall alcohol‐attributed disease burden by age‐standardised disability‐adjusted life‐years rates per 100 000 in the Nordic countries between 2000 and 2017.
Official websites use .gov
A
.gov website belongs to an official
government organization in the United States.
Secure .gov websites use HTTPS
A lock (
) or https:// means you've safely
connected to the .gov website. Share sensitive
information only on official, secure websites.
Absolute and relative gender differences in overall alcohol‐attributed disease burden by age‐standardised disability‐adjusted life‐years rates per 100 000 in the Nordic countries between 2000 and 2017.