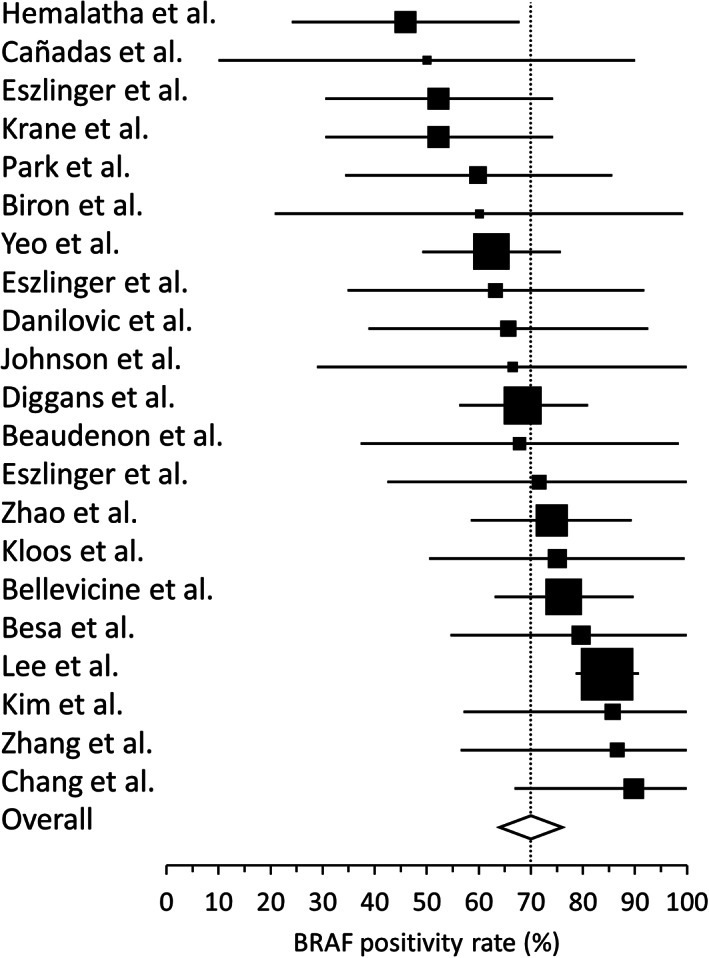
FIGURE 1.

Forest plot for BRAF p.V600E positivity rates reported in 21 peer‐reviewed publications. 7 , 8 , 9 , 10 , 11 , 12 , 13 , 14 , 15 , 16 , 17 , 18 , 19 , 20 , 21 , 22 , 23 , 24 , 25 , 26 , 27 Black boxes represent the relative weight of each study, whiskers represent the 95% confidence intervals for each reported BRAF rate and the diamond represents the calculated pooled rate assuming a random effect model (70% pooled rate, 95% confidence intervals: 64%‐76%, I2 = 0%)
