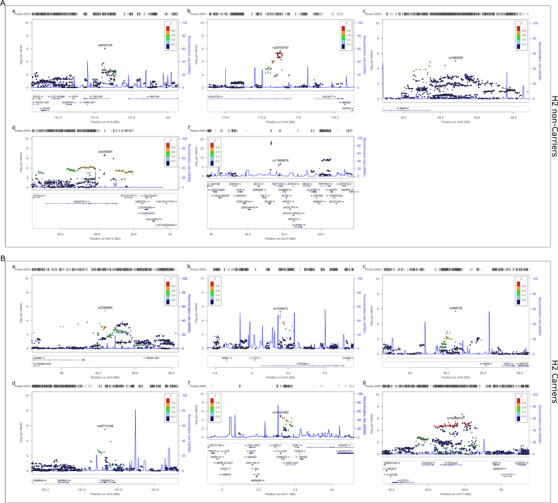
FIGURE 2.

Regional association plots of discordant MAPT haplotype–stratified association results: The figures are shown for the 11 loci depicted in Table 2 and reflect the results of haplotype‐stratified joint association analyses without the APOE covariate. Discordant loci results with significance in the (A) H2 non‐carriers or (B) H2 carriers.
