
FIGURE 3.
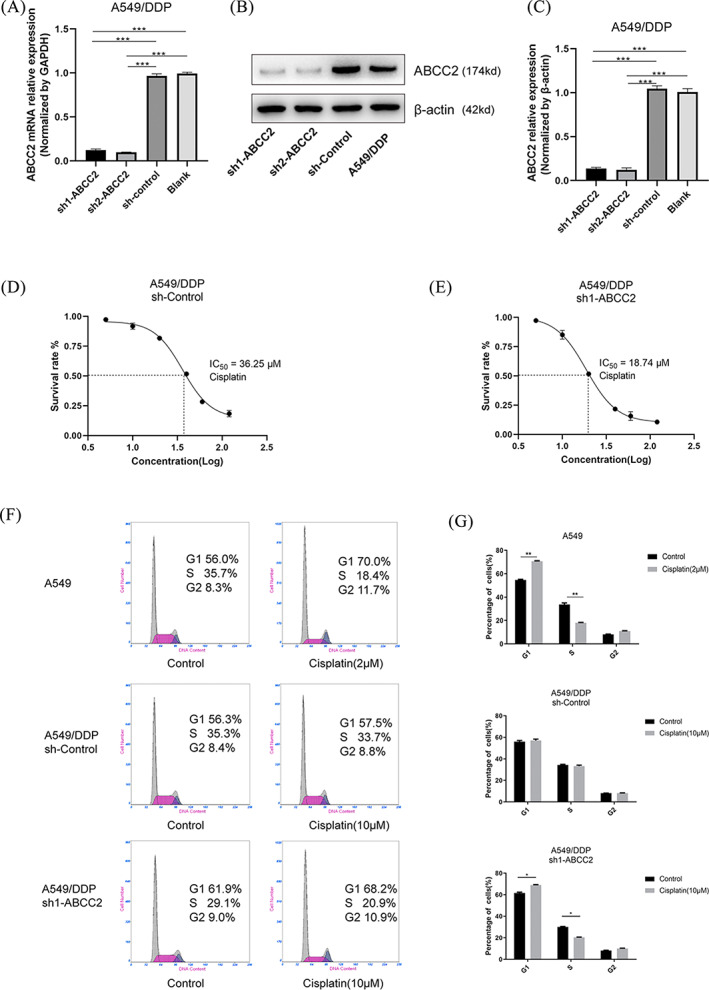
Knockdown of ABCC2 partially reversed the resistance of A549/DDP to DDP. A‐C, ABCC2 expression was analysed using qRT‐PCR and western blot assays after A549/DDP cells were transfected with sh1‐ABCC2, sh2‐ABCC2 and sh‐control. D,E, The IC50 in A549/DDP transfected with sh‐control or sh1‐ABCC2 were 36.25 and 18.74 μM, respectively. The concentrations of DDP in A549/DDP were 5, 10, 20, 40, 60, and 120 μM. F,G, A549 cells were treated with DDP (2 μM) for 48 hours. A549/DDP cells were treated with DDP (10 μM) for 48 hours. Cell cycle distribution assays were performed in A549 and A549/DDP cells using flow cytometry (n = 3, each group). *p < 0.05, **p < 0.01,***p < 0.001