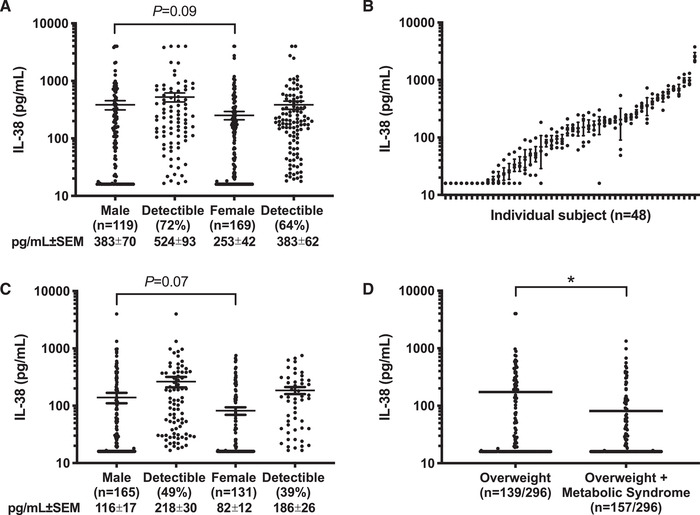
Figure 1.

Level of IL‐38 in healthy subjects. (A) Mean ± SEM of plasma IL‐38 concentrations in 119 male and 169 female healthy subjects of the healthy cohort. Shown separately by sex is the percentage of subjects with levels above the lower limit of quantitation (16 pg/mL). (B) Mean ± SEM of plasma IL‐38 concentrations in 48 healthy subjects (61% male) in samples collected at four visits at 3‐month intervals over the course of 1 year. (C) Mean ± SEM of plasma IL‐38 concentrations in 165 male and 131 female of the overweight cohort. Shown separately by sex is the percentage of subjects with levels above the lower limit of quantification (16 pg/mL). (D) Mean ± SEM of plasma IL‐38 concentrations in the overweight cohort divided by metabolic syndrome status. Per cohort, IL‐38 concentrations were measured in one experiment by ELISA. Statistical analysis was performed using the Mann–Whitney test, *p < 0.05.
