Figure 4.

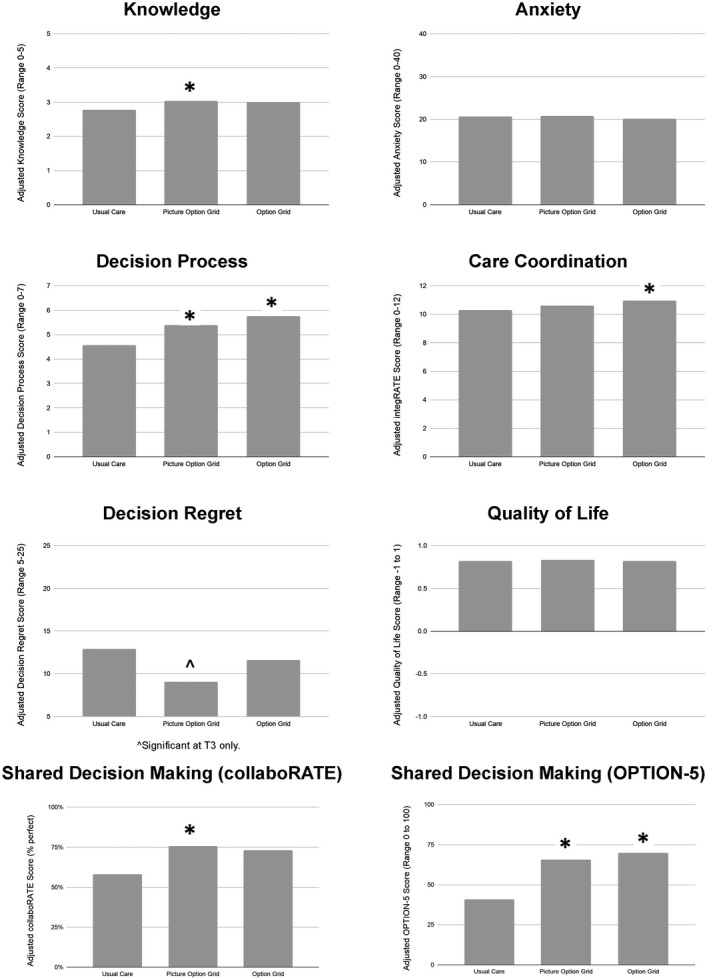
Bar graphs of adjusted scores for primary and secondary outcome measures by arm and across time points. An asterisk denotes statistical significance at P < .05.

Bar graphs of adjusted scores for primary and secondary outcome measures by arm and across time points. An asterisk denotes statistical significance at P < .05.