Figure 1.

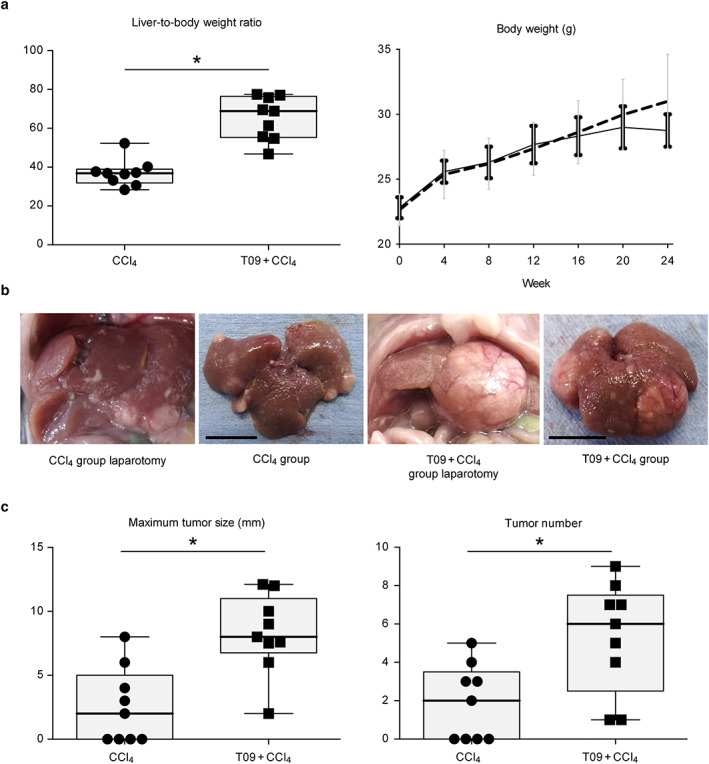
Liver‐to‐body weight ratio and gross appearance of livers and tumors. (a) Body weight and liver‐to‐body weight ratio (n = 9). Change in body weight over 24 weeks (n = 6).  , CCl4;
  , T09 + CCl4. (b) Photographs of livers and tumors. Left panel, photographs taken at laparotomy; right panel, photographs taken immediately after removal (bar length = 1 cm). (c) Maximum tumor size and tumor number (n = 9). The results are expressed as the mean ± SD and were compared with the Mann–Whitney U‐test. [Color figure can be viewed at wileyonlinelibrary.com]
