Figure 3.

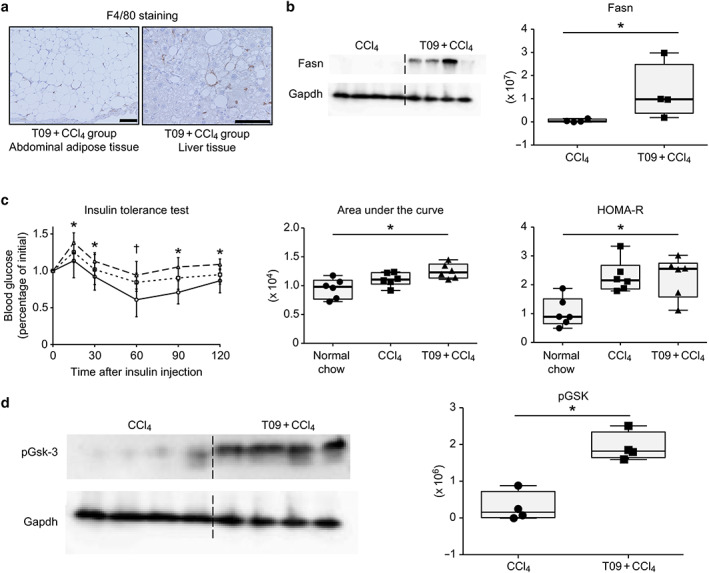
Abnormal lipid metabolism and insulin resistance. (a) Representative F4/80 immunostaining of adipose tissue and liver tissue from the T09 + CCl4 group. (b) Fatty acid synthetase (Fasn) protein expression in the CCl4 and T09 + CCl4 groups. (c) Insulin tolerance test, area under the curve, and homeostasis model assessment of insulin resistance (HOMA‐R) score.  , T09 + CCl4;
  , CCl4;
  , normal chow. (d) Phospho‐glycogen synthetase kinase 3 (pGsk‐3) protein expression in the CCl4 and T09 + CCl4 groups. The results are expressed as the mean ± SD and were compared with the Mann–Whitney U‐test. Scale bars: 100 μm. [Color figure can be viewed at wileyonlinelibrary.com]
