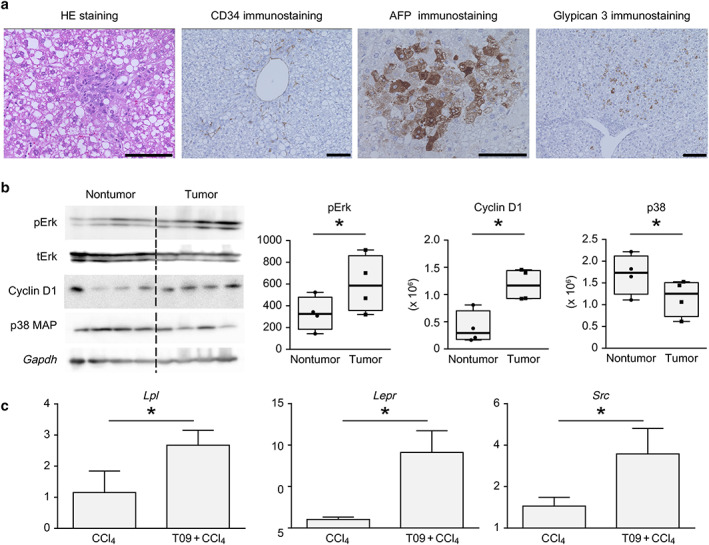
Figure 4.

Pathological findings and analysis of protein levels in tumors. (a) Representative hematoxylin and eosin (HE) staining and CD34, AFP, and glypican 3 immunostaining in tumors from the T09 + CCl4 group. (b) pErk, cyclin D1, and p38 MAP protein levels in nontumor and tumor tissues from the T09 + CCl4 group. The results are expressed as the mean ± SD and were compared with the Mann–Whitney U‐test. P < 0.05 for the comparison of nontumor tissue versus tumor tissue. Scale bars: 100 μm. (c) Upregulated expression of genes involved in non‐alcoholic steatohepatitis‐related carcinogenesis, shown by microarray analysis. (a) mRNA expression of Lpl in the liver. (b) mRNA expression of Lepr in the liver. (c) mRNA expression of Src in the tumor. The data are expressed as the mean ± SD (n = 5). P < 0.05 versus the CCl4 group. [Color figure can be viewed at wileyonlinelibrary.com]
