
Figure 3.
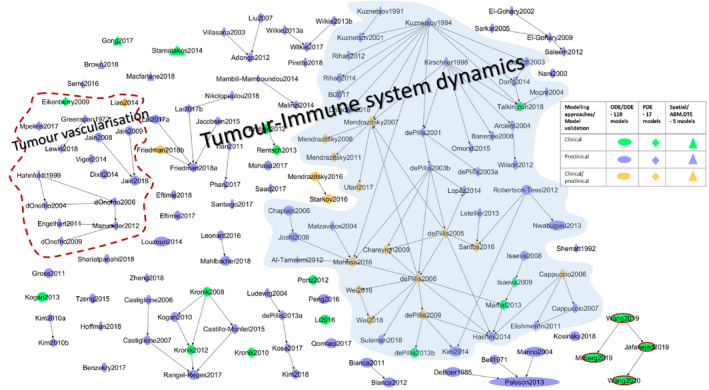
Mechanistic models of cancer‐immunity cycle and immunotherapies. An overview of the literature‐based models of cancer and immune system dynamics that is reviewed in this study. Although most of the models belong to the tumor and immune system dynamics, few models that describe the dynamics of specific processes in tumor microenvironment are also included. For example, a model that describes macrophage dynamics, tumor‐stromal cross‐talk, T‐helper cell differentiation in the context cancer are included (see Supplementary Material S1 for details of these models). The four models on the bottom right corner where the nodes are highlighted in red are immuno‐oncology quantitative systems pharmacology platform models that were published recently. The models highlighted in blue shade are a chunk of models that are derived and expanded from the first generation of models (see the main text for details). Modeling approaches and the study type used for model validation are reflected as shapes and colors as defined in the key table. The node size represents the model size (i.e., the number of cell‐types, cytokines, and other molecular entities included in the models). Model size is not always the number of variables in the models. For example, the intermediate variables and protein complexes are not taken into account. The size of the models ranges from 2 to 21. The “Fully‐integrated Immune Response Model – FIRM” model is the biggest model in our list with 21 different cell types and cytokines. ODE, ordinary differential equation.