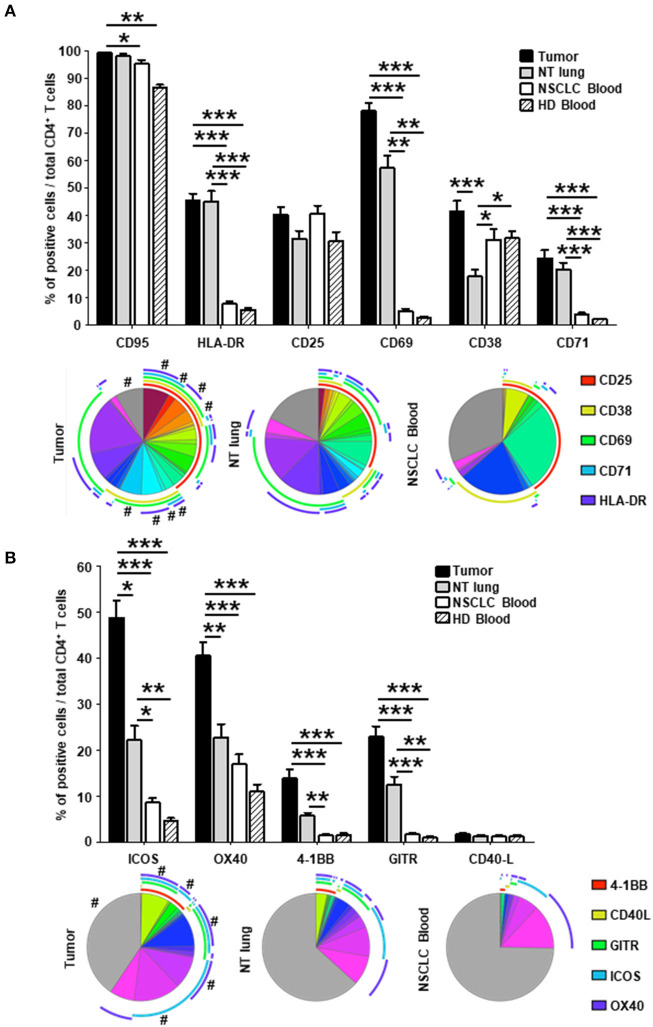
Figure 2.
Higher percentages of activated CD4+ in tumors vs. NT sites. Histograms represent the percentages of CD4+ T cells expressing activation markers (A) and co-stimulatory molecules (B) among total CD4+ T cells in NSCLC tumor, non-tumor (NT) lung, NSCLC peripheral blood and healthy donor (HD) peripheral blood (mean ± SEM) sites. P-values were calculated with one-way ANOVA/Kruskal-Wallis/Dunn's test. *p < 0.05, **p < 0.005, ***p < 0.001. The pie charts below each histogram depict the proportion of CD4+ T cells with each distinct marker profile in each compartment. The highly expressed CD95 marker (>85% of CD95+ CD4+ T cells in every compartment) was not included in the analysis. The arcs around each pie chart represent the individual markers studied, as noted in the arc legend. The pie slice colors represent the different combinations of markers observed. A # at the periphery of the pie slices indicates a statistically significant difference (p < 0.05) for that individual marker combination between NSCLC tumor, NT lung and NSCLC peripheral blood, determined by a Wilcoxon sign rank test. HD, healthy donor; NSCLC, non-small-cell lung cancer; NT, non-tumor.

