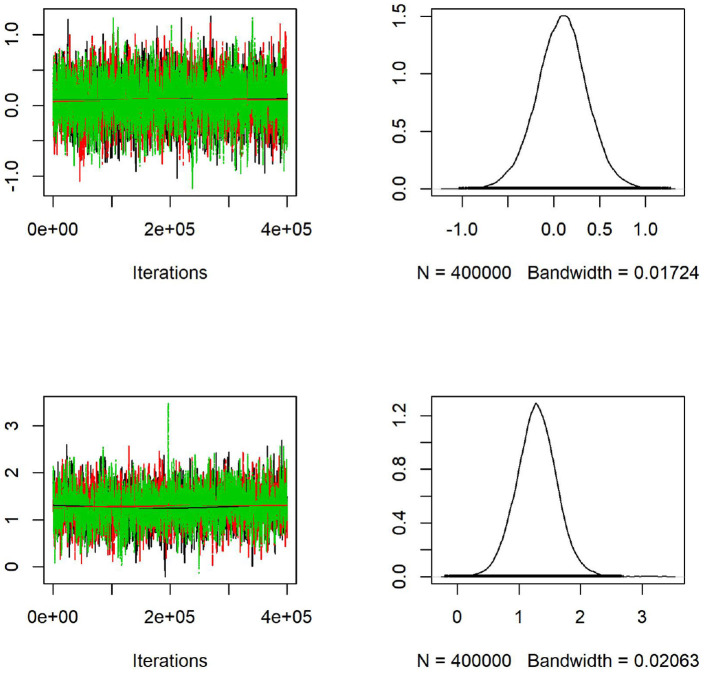
Figure 8.
Convergence of the Markov chains: trace (left) and posterior density (right) plots for the regression parameters of population (first row) and density (second row) as covariates in the spatial model applied to CSD16 samples from New York City. Density has a significant effect on the E. coli resistant genes abundance as shown in the graph with 95% confidence interval not containing zero.

