FIGURE 2.

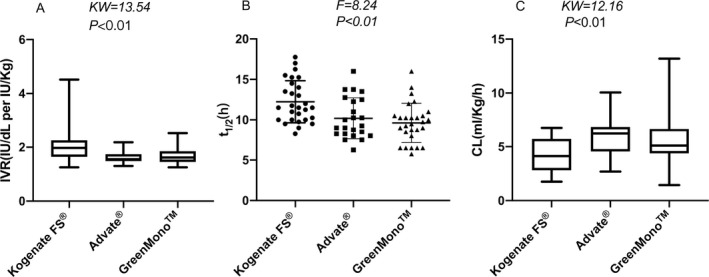
Comparison of IVR, t1/2, and CL among the three concentrate brand groups. IVR and CL data are shown as median (range), while t1/2 data are shown as mean ± standard deviation. t1/2, half‐life time; IVR, in vivo recovery; CL, clearance.

Comparison of IVR, t1/2, and CL among the three concentrate brand groups. IVR and CL data are shown as median (range), while t1/2 data are shown as mean ± standard deviation. t1/2, half‐life time; IVR, in vivo recovery; CL, clearance.