
FIGURE 3.
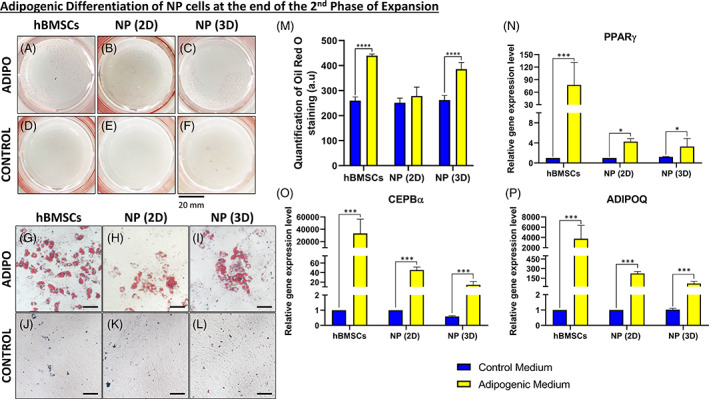
Adipogenic differentiation of NP cells at the end of the second expansion phase. A‐C, Macroscopic analysis of Oil‐Red‐O staining after 21 days of culture into the adipogenic medium for, A, human Bone marrow mesenchymal stromal cells (hBMSCs), B, nucleus pulposus (NP) cells previously cultured in two‐dimensional (2D) (NP [2D]), and, C, NP cells previously cultured in three‐dimensional (3D) (NP [3D]). D‐F, Macroscopic analysis of Oil‐Red‐O staining after 21 days of culture into control medium for, D, hBMSCs, E, NP cells previously cultured in 2D (NP [2D]), and, F, NP cells previously cultured in 3D (NP [3D]). G‐L, Microscopic analysis of Oil‐Red‐O staining after 21 days of culture into the adipogenic medium for, G, hBMSCs, H, NP cells previously cultured in 2D (NP [2D]) and, I, NP cells previously cultured in 3D (NP [3D]). J‐L, Macroscopic analysis of Oil‐Red‐O staining after 21 days of culture into control medium for, J, hBMSCs, K, NP cells previously cultured in 2D (NP [2D]), and, L, NP cells previously cultured in 3D (NP [3D]). M, Quantification of Oil‐Red‐O staining for hBMSCs, NP cells previously cultured in 2D (NP [2D]), and NP cells previously cultured in 3D (NP [3D]) after 21 days in the adipogenic and control medium. N‐P, Quantification of the relative gene on NP cells (previously cultivated in 2D or 3D) for different adipogenic related genes after culture on the fibronectin‐coated surface with the adipogenic or control medium. N, Relative gene expression of peroxisome proliferator‐activated receptor gamma (PPARγ) in NP cells. O, Relative gene expression of CCAAT/enhancer‐binding protein alpha (CEPBα) in NP cells. P, Relative gene expression of adiponectin (ADIPOQ) in NP cells (n = 6) for each gene. Data are presented as mean ± SD. NP cells cultured in the control medium = blue bars. NP cells cultured in the adipogenic medium = yellow bars. Scale bar: For pictures, G, until, L, the scale bar represent 100 μm