
FIGURE 4.
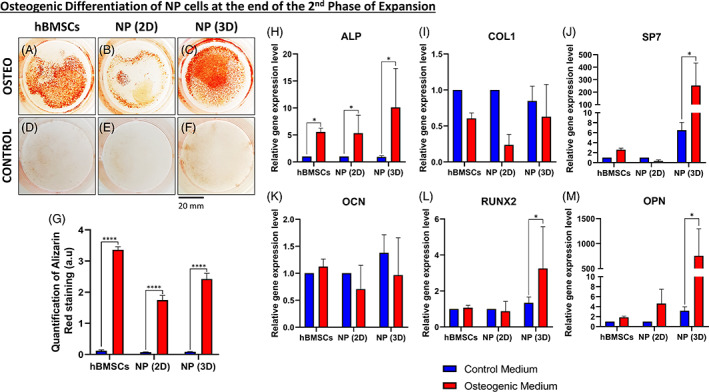
Osteogenic differentiation of NP cells at the end of the second expansion phase. A‐C, Macroscopic analysis of Alizarin Red staining after 21 days of culture into the osteogenic medium for, A, human bone marrow mesenchymal stromal cells (hBMSCs), B, nucleus pulposus (NP) cells previously cultured in two‐dimensional (2D) (NP [2D]), and, C, NP cells previously cultured in three‐dimensional (3D) (NP [3D]). D‐F, Macroscopic analysis of Alizarin Red staining after 21 days of culture into the control medium for, D, hBMSCs, E, NP cells previously cultured in 2D (NP [2D]), and, F, NP cells previously cultured in 3D (NP [3D]). G, Quantification of Alizarin Red staining for hBMSCs, NP cells previously cultured in 2D (NP [2D]), and NP cells previously cultured in 3D (NP [3D]) after 21 days in the osteogenic and control medium. H‐M, Quantification of the relative gene on NP cells (previously cultivated in 2D or 3D) for different osteogenic related genes after culture on the fibronectin‐coated surface with the osteogenic or control medium. H, Relative gene expression of alkaline phosphatase (ALPL) in NP cells. I, Relative gene expression of collagen type I (COL1) in NP cells. J, Relative gene expression of osterix (SP7) in NP cells. K, Relative gene expression of osteocalcin (OCN) in NP cells. L, Relative gene expression of runt‐related transcription factor 2 (RUNX2) in NP cells. M, Relative gene expression of osteopontin (OPN) in NP cells (n = 5) for each gene. Data are presented as mean ± SD. NP cells cultured in the control medium = blue bars. NP cells cultured in the osteogenic medium = red bars