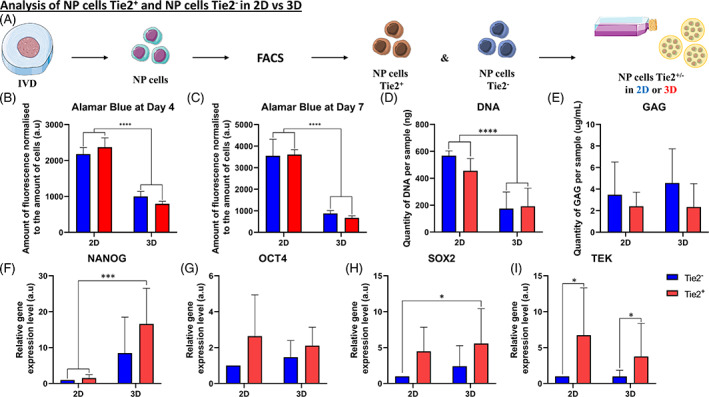
FIGURE 7.

Comparison of nucleus pulposus (NP) cells Tie2+ and NP cells Tie2−. A, Schematic representation of the process leading to the comparison of NP cells Tie2+ and NP cells Tie2−. Briefly, after dissection and digestion of the NP tissue from intervertebral disk (IVD), NP cells were sorted for angiopoietin‐1 receptor (Tie2) marker. Positive (Tie2+) and negative (Tie2−) cells were seeded in two‐dimensional (2D) or in three‐dimensional (3D) (into alginate beads) and analyzed. A,B, Quantification of cell metabolism by Alamar Blue assay on Tie2+ and Tie2− NP cells (cultivated in 2D or 3D) at, A, day 4 and, B, day 7. D, Quantification of GAG produced in NP cells (Tie2+ and Tie2−) in 2D or in 3D at day 7. E, Quantification of DNA measured in NP cells (Tie2+ and Tie2−) in 2D or in 3D after day 7. F‐I, Quantification of the relative gene expression on NP cells (Tie2+ and Tie2−) after culture in 2D or in 3D for 1 week of culture. F, Relative gene expression of homeobox protein NANOG (NANOG) in NP cells (Tie2+ and Tie2−) in 2D or in 3D. G, Relative gene expression of SRY (sex determining region Y)‐box 2 (SOX2) in NP cells (Tie2+ and Tie2−) in 2D or in 3D. H, Relative gene expression of octamer‐binding transcription factor 4 (OCT4) in NP cells (Tie2+ and Tie2−) in 2D or in 3D. I, Relative gene expression of angiopoietin‐1 receptor (TEK) in NP cells (Tie2+ and Tie2−) in 2D or in 3D (n = 5) for each gene. Data are presented as mean ± SD. Culture of NP cells (Tie2−) = blue bars. Culture of NP cells (Tie2+) = red bars
