
FIGURE 9.
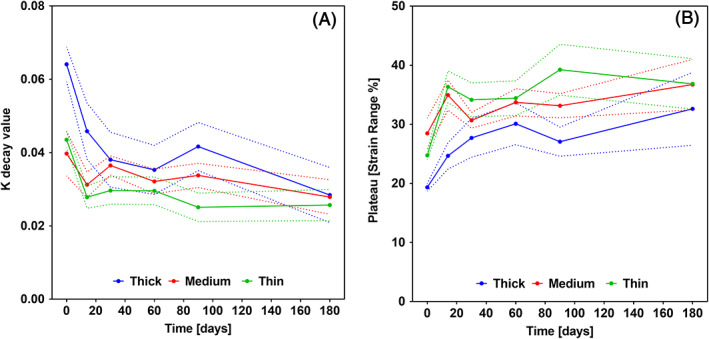
K (A) and Plateau (B) values for the one phase decay fitted to recovery against maximum strain data grouped by time point and membrane type. n = 5
Official websites use .gov
A
.gov website belongs to an official
government organization in the United States.
Secure .gov websites use HTTPS
A lock (
) or https:// means you've safely
connected to the .gov website. Share sensitive
information only on official, secure websites.
K (A) and Plateau (B) values for the one phase decay fitted to recovery against maximum strain data grouped by time point and membrane type. n = 5