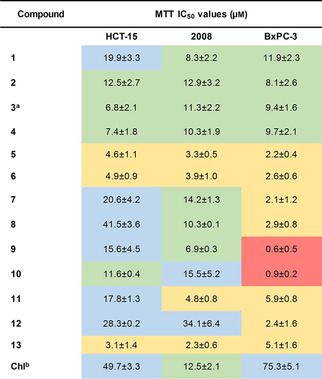
Table 1.
MTT assay IC50 values with associated SDs of test bis‐3‐chloropiperidines against HCT‐15, 2008 and BxPC‐3 cells after 72 h of treatment. IC50 values were calculated from two independent experiments by a four‐parameter logistic model. Values highlighted in red: IC50≤1.0 μm; in yellow: 1.1≤IC50≤6.0 μm; in green: 6.1≤IC50≤15.0 μm; in blue: IC50≥15.1 μm.
|
|