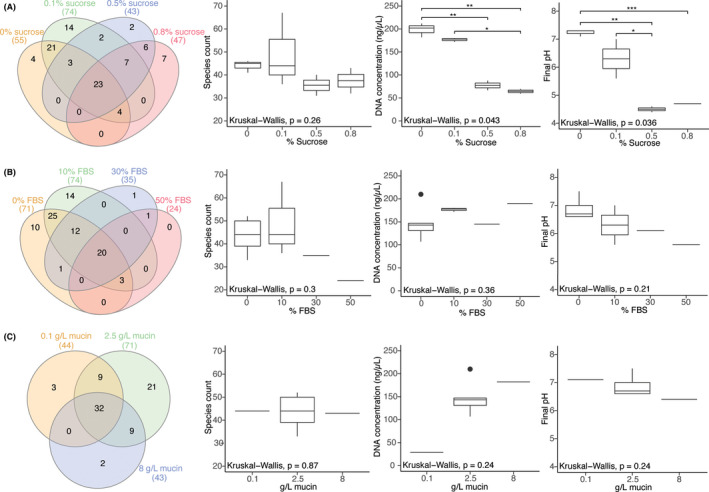
FIGURE 2.

Venn diagram of the number of shared species and boxplots of species count, DNA concentration, and final pH for (A) varying sucrose concentrations with fixed 10% FBS and 2.5g/L mucin; (B) varying FBS concentrations with fixed 0.1% sucrose and 2.5g/L mucin; and (C) varying mucin concentrations with fixed 0.1% sucrose and 0% FBS. If a species was present in at least one replicate, then it was represented in the Venn diagram. Significance is shown with asterisks, all conditions without asterisks are not significant; *: p ≤ .05, **: p ≤ .01, ***: p ≤ .001 [Colour figure can be viewed at wileyonlinelibrary.com]
