
FIGURE 1.
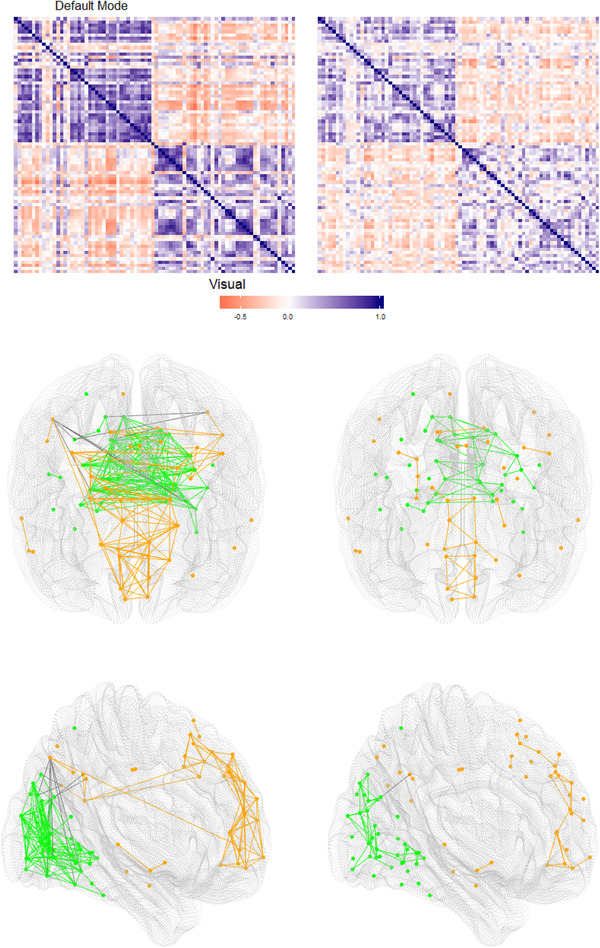
Top: Matrices of correlations among 80 ROIs comprising the default mode network and visual network in our fMRI data set. The left and right matrices, respectively, attain the highest and lowest connectivity scores observed in our data set. Middle: Brain maps (axial view) corresponding to the same two correlation matrices, and displaying pairs of regions with absolute correlation above 0.6. Orange nodes and links refer to the default mode network; green nodes and links refer to the visual network; links between the two networks are shown in black. Bottom: Same brain maps, sagittal view. The fMRI data are presented in Section 4, and the connectivity score is discussed briefly in Web Appendix A