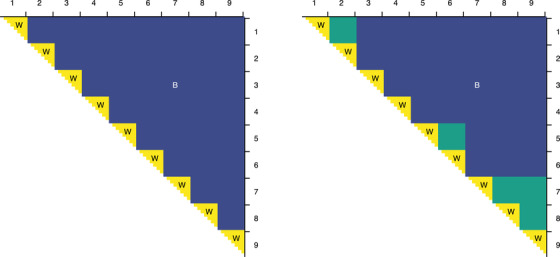
FIGURE 2.

Left: Schematic diagram of a matrix of distances among repeated observations of nine individuals, with rows and columns grouped by individual. Distances in the half‐squares along the diagonal are within‐individual (W), while the rest are between‐individual (B). Right: A similar diagram, but for a bootstrap sample with repeated observations. Distances shown in green are nominally between‐individual, but in reality, they are within‐individual
