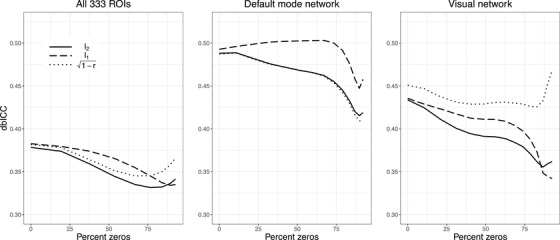
FIGURE 5.

Estimated dbICC, for the same distances and sets of ROIs as in Table 2, but with soft‐thresholding of the correlation values. The horizontal axis denotes the average percentage of the correlations that are shrunk to zero, as the threshold increases
