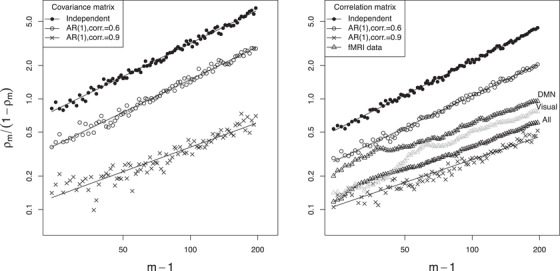
FIGURE 6.

Left: Effect of measurement intensity on SNR for covariance matrix estimation with simulated data. Both axes are plotted on the log scale since, as explained at (18), this is expected to yield a linear relation with slope 1 for independent observations. Right: Simulation results for correlation matrix estimation, along with results based on subsets of the fMRI time series
