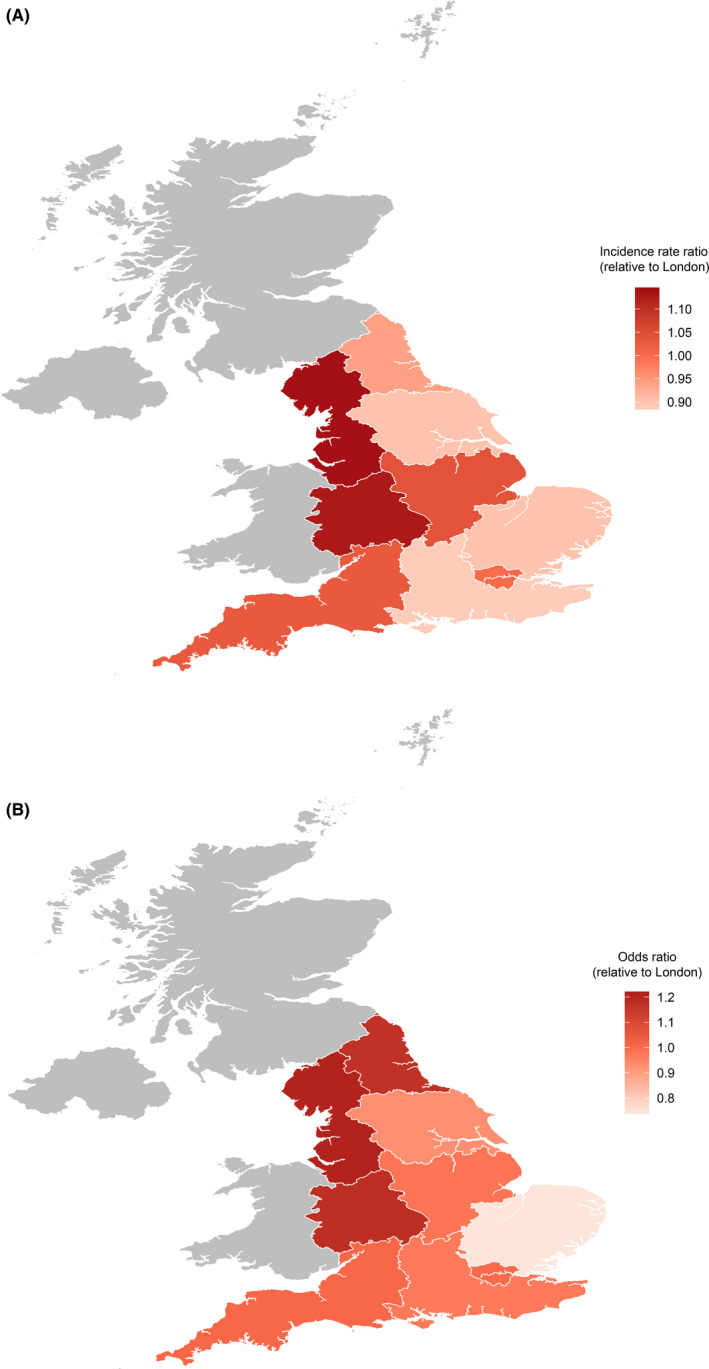
FIGURE 3.

The geographical distribution of eczema in England. (A) Adjusted incidence rate ratios (aIRR) for eczema in 2018 by geographical region (n = 2,336,322). aIRR are relative to London. (B) Adjusted odds ratios (OR) for active eczema in 2018 by geographical region (n = 2,742,094). OR are relative to London
