Figure 2.

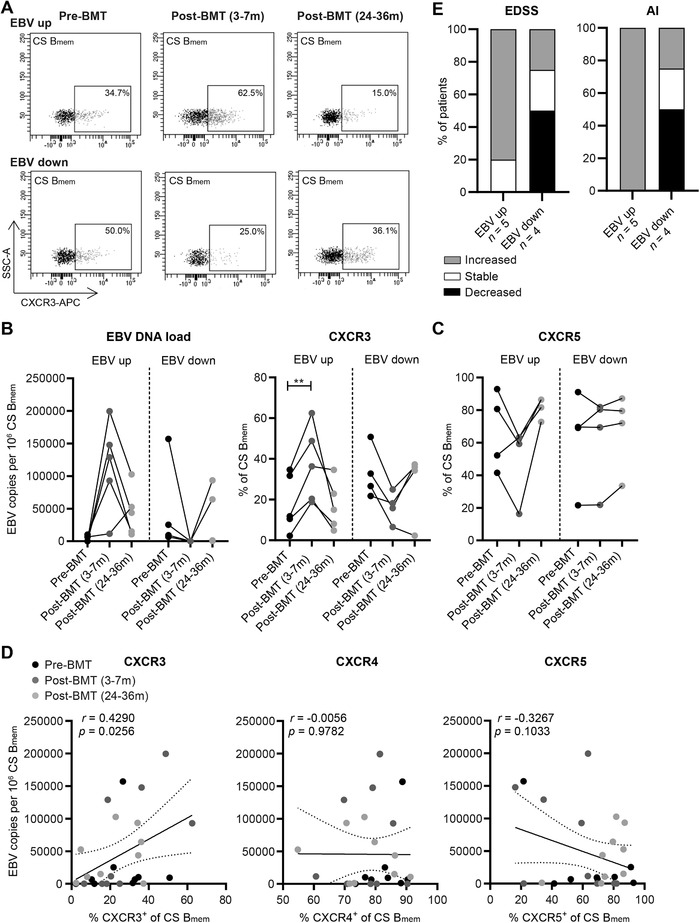
The association between EBV load and chemokine receptor expression in class‐switched B cells of BMT‐treated MS patients. (A) Representative flow cytometry plots of CXCR3‐expressing class‐switched (CS) Bmem cells from an MS patient before and both 3–7 months and 24–36 months after autologous BMT. EBV copy numbers measured by qPCR and frequencies of CXCR3+ (B) as well as CXCR5+ (C) fractions were determined for CS Bmem cells of nine BMT‐treated MS patients. (D) EBV copy numbers were correlated to CXCR3+, CXCR4+, and CXCR5+ fractions of CS Bmem cells. Data were collected in the same number of experiments as depicted in Figure 1. (E) Expanded disability status scale (EDSS) and ambulatory index (AI) changes after BMT treatment (∆ pre‐ vs. 36 months post‐BMT) for patients showing increased (n = 5) and decreased (n = 4) memory B‐cell EBV loads and measured by questionnaires. **p < 0.01. The p values were calculated by repeated measures one‐way ANOVA with Tukey's post hoc test (B and C) and correlation coefficient by Pearson rank (D).
