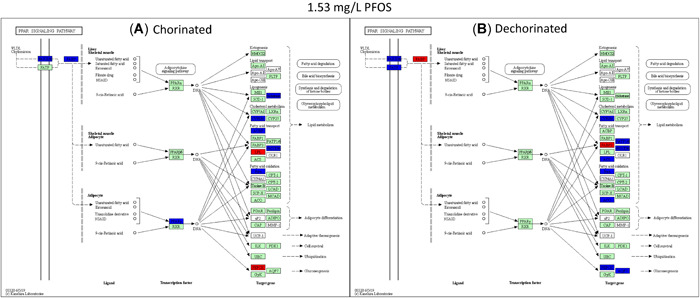
Figure 4.

Kyoto Encyclopedia of Genes and Genomes pathway analysis showing the peroxisome proliferator–activated receptor pathway genes significantly expressed at 1.5‐fold and greater for the chorinated (A) and dechorinated (B) embryos exposed to 1.53 mg/L perfluorooctanesulfonic acid. Red indicates genes that were up‐regulated relative to the respective control, blue indicates genes that were down‐regulated relative to the respective control, and green indicates genes that were analyzed but did not differ from the respective control. PFOS = perfluorooctanesulfonic acid; PPAR = peroxisome proliferator–activated receptor.
