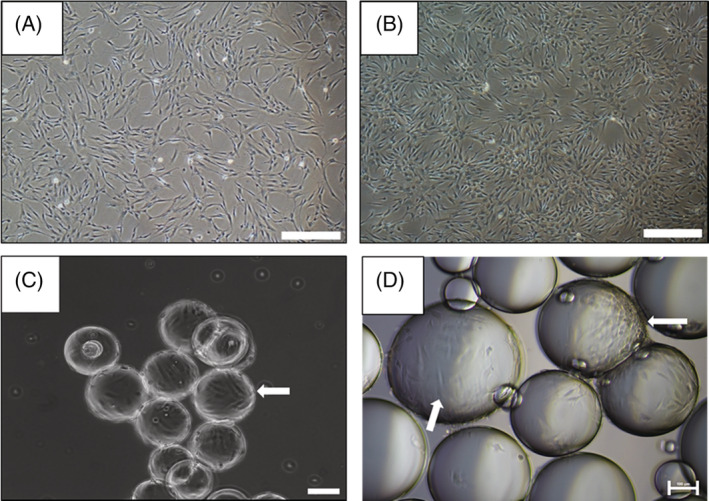
Figure 2.

hMSC morphology when cultured on: (A) tissue culture plastic; (B) 2D perfluorocarbon/DMEM system; (C) commercially available microcarriers (e.g., Cytodex‐1); and (D) perfluorocarbon ‘liquid microcarriers’. Scale bar represents, in (A) and (B), 500 μm; and, in (C) and (D), 100 μm. White arrows show the elongated shape of hMSCs on the Cytodex solid microcarriers (C) and the perfluorocarbon liquid microcarriers (D).
