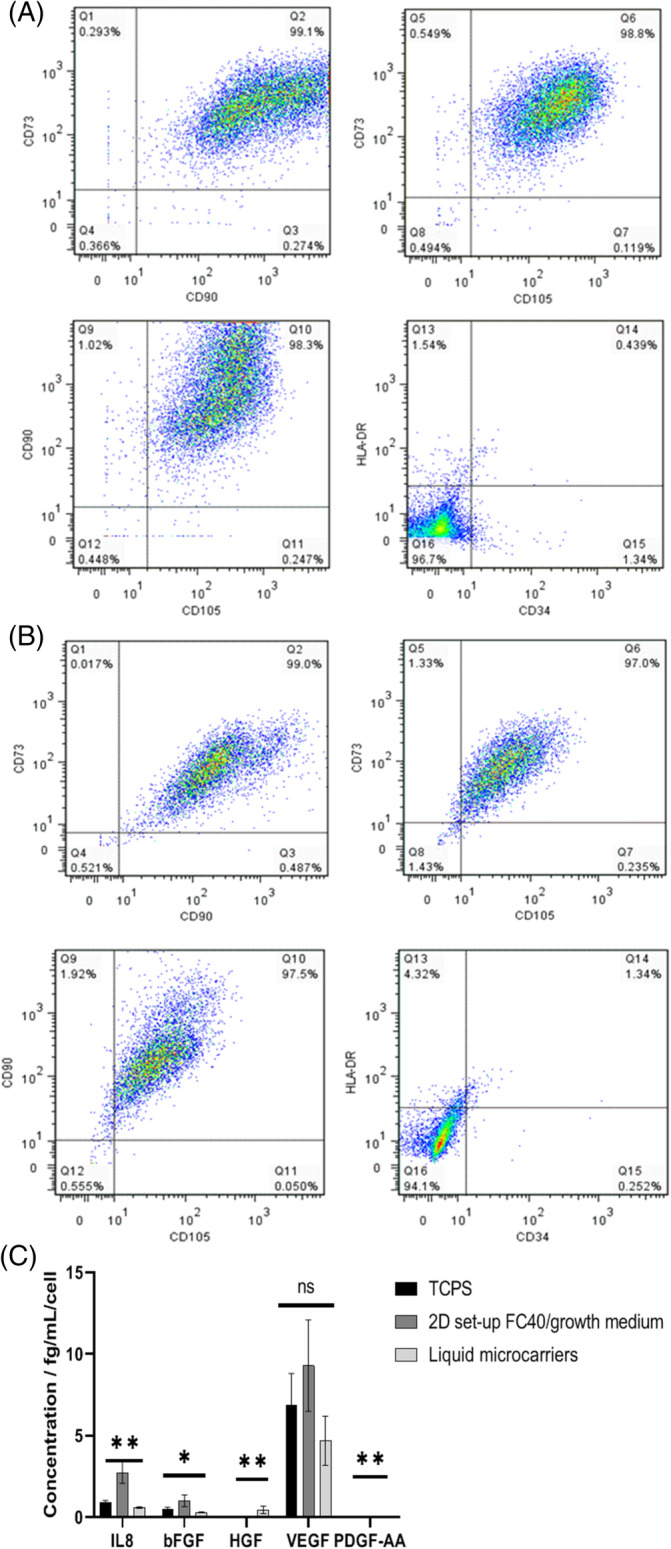
Figure 5.

Multiparameter flow cytometry assessment of hMSC2 donor line expression of CD73, CD90, CD105, HLA‐DR and CD34 (A) pre‐expansion (TCPS) and (B) post‐expansion on the liquid microcarriers. (C) Pro‐angiogenic growth factor profile per cell at day 6 in culture for hMSC2 donor line cultured on TCPS and liquid microcarriers. Data are shown as mean ± SD (n = 3; **P < 0.001; ns, non‐significant.
