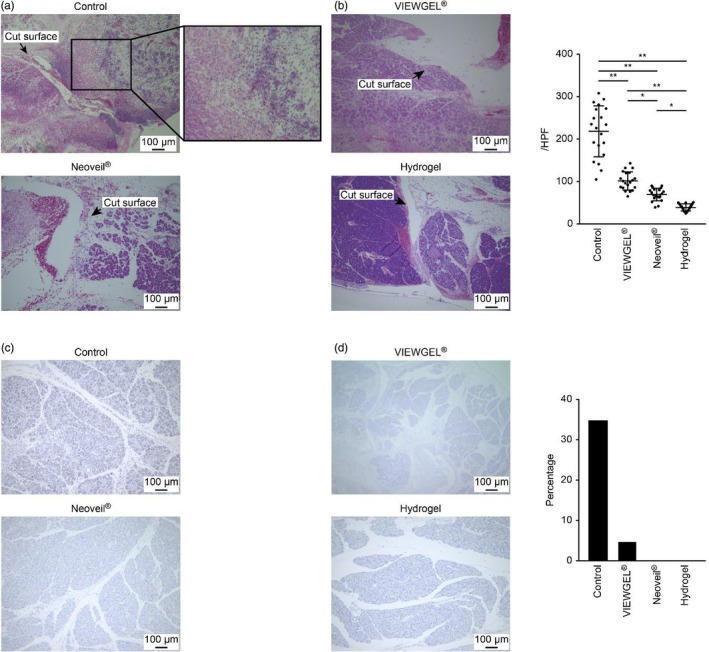
FIGURE 4.

Pathological evaluation and inflammatory cell infiltration of pancreatic tissue 48 h after surgery. Scale bar = 100 µm. A, Histology of the pancreatic transection site assessed by hematoxylin and eosin staining. B, Number of inflammatory cells in 20 high‐power fields. The results are expressed as the means ± SDs and were compared using one‐way ANOVA. *P < .05, **P < .01. C, IL‐6 immunostaining. D, Percentage of area stained positive for IL‐6
