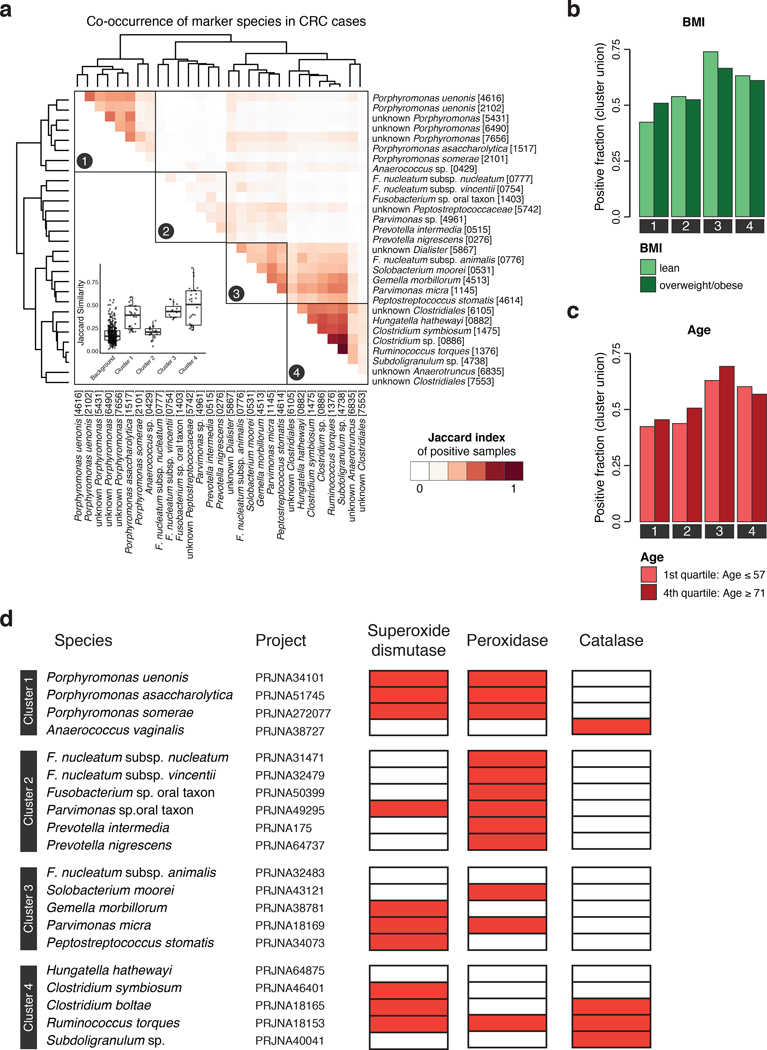
Extended Data Figure 5: The core set of CRC-enriched microbial species can be stratified into four clusters based on co-occurrence in CRC metagenomes.
(a) The heatmap shows the Jaccard index (computed by comparing marker-positive samples, see Methods) for the core set of microbial marker species, compute on CRC cases only. Clustering was performed using the Ward algorithm as implemented in the R function hclust. The inset shows the distribution of Jaccard similarities within each cluster and for the background (all similarities between species not in the same cluster, n=841). Boxes denote the interquartile ranges (IQR) with the median as thick black line and whiskers extending up to the most extreme points within 1.5-fold IQR. (b) Barplots show the fraction of CRC samples that are positive for a marker species clusters (defined as the union of positive marker species) broken down by patient subgroups based on BMI and (c) age (see Fig. 2bcd for other patient subgroups). Significance of the associations between CRC subgroups and marker species clusters were tested using the Cochran-Mantel-Haenszel test blocked for study (but no significant associations were detected). (d) For the core set of microbial species with a genomic reference, the presence (red) or absence (white) of superoxide dismutase, peroxidase, and catalase are shown as heatmap (see Methods).

